Contents
Foreword
Preface to the second edition
Preface to the first edition
Acknowledgments
PART I PRELIMINARIES
Chapter 1 Introduction
1.1 What Is Data Mining?
1.2 Where Is Data Mining Used?
1.3 Origins of Data Mining
1.4 Rapid Growth of Data Mining
1.5 Why Are There So Many Different Methods?
1.6 Terminology and Notation
1.7 Road Maps to This Book
Chapter 2 Overview of the Data Mining Process
2.1 Introduction
2.2 Core Ideas in Data Mining
2.3 Supervised and Unsupervised Learning
2.4 Steps in Data Mining
2.5 Preliminary Steps
2.6 Building a Model: Example with Linear Regression
2.7 Using Excel for Data Mining
PROBLEMS
PART II DATA EXPLORATION AND DIMENSION REDUCTION
Chapter 3 Data Visualization
3.1 Uses of Data Visualization
3.2 Data Examples
3.3 Basic Charts: bar charts, line graphs, and scatterplots
3.4 Multidimensional Visualization
3.5 Specialized Visualizations
3.6 Summary of major visualizations and operations, according to data mining goal
PROBLEMS
Chapter 4 Dimension Reduction
4.1 Introduction
4.2 Practical Considerations
4.3 Data Summaries
4.4 Correlation Analysis
4.5 Reducing the Number of Categories in Categorical Variables
4.6 Converting A Categorical Variable to A Numerical Variable
4.7 Principal Components Analysis
4.8 Dimension Reduction Using Regression Models
4.9 Dimension Reduction Using Classification and Regression Trees
PROBLEMS
PART III PERFORMANCE EVALUATION
Chapter 5 Evaluating Classification and Predictive Performance
5.1 Introduction
5.2 Judging Classification Performance
5.3 Evaluating Predictive Performance
PROBLEMS
PART IV PREDICTION AND CLASSIFICATION METHODS
Chapter 6 Multiple Linear Regression
6.1 Introduction
6.2 Explanatory versus Predictive modeling
6.3 Estimating the Regression Equation and Prediction
6.4 Variable Selection in Linear Regression
PROBLEMS
Chapter 7 k-Nearest Neighbors (k-NN)
7.1 k-NN Classifier (categorical outcome)
7.2 k-NN for a Numerical Response
7.3 Advantages and Shortcomings of k-NN Algorithms
PROBLEMS
Chapter 8 Naive Bayes
8.1 Introduction
8.2 Applying the Full (Exact) Bayesian Classifier
8.3 Advantages and Shortcomings of the Naive Bayes Classifier
PROBLEMS
Chapter 9 Classification and Regression Trees
9.1 Introduction
9.2 Classification Trees
9.3 Measures of Impurity
9.4 Evaluating the Performance of a Classification Tree
9.5 Avoiding Overfitting
9.6 Classification Rules from Trees
9.7 Classification Trees for More Than two Classes
9.8 Regression Trees
9.9 Advantages, weaknesses, and Extensions
PROBLEMS
Chapter 10 Logistic Regression
10.1 Introduction
10.2 Logistic Regression Model
10.3 Evaluating Classification performance
10.4 Example of Complete Analysis: Predicting Delayed Flights
10.5 Appendix: logistic Regression for Profiling
PROBLEMS
Chapter 11 Neural Nets
11.1 Introduction
11.2 Concept And Structure Of A Neural Network
11.3 Fitting A Network To Data
11.4 Required User Input
11.5 Exploring The Relationship Between Predictors And Response
11.6 Advantages And Weaknesses Of Neural Networks
PROBLEMS
Chapter 12 Discriminant Analysis
12.1 Introduction
12.2 Distance of an Observation from a Class
12.3 Fisher’s Linear Classification Functions
12.4 Classification performance of Discriminant Analysis
12.5 Prior Probabilities
12.6 Unequal Misclassification Costs
12.7 Classifying more Than Two Classes
12.8 Advantages and Weaknesses
PROBLEMS
PART V MINING RELATIONSHIPS AMONG RECORDS
Chapter 13 Association Rules
13.1 Introduction
13.2 Discovering Association Rules in Transaction Databases
13.3 Generating Candidate Rules
13.4 Selecting Strong Rules
13.5 Summary
PROBLEMS
Chapter 14 Cluster Analysis
14.1 Introduction
14.2 Measuring Distance Between Two Records
14.3 Measuring Distance Between Two Clusters
14.4 Hierarchical (Agglomerative) Clustering
14.5 Nonhierarchical Clustering: The k-Means Algorithm
PROBLEMS
PART VI FORECASTING TIME SERIES
Chapter 15 Handling Time Series
15.1 Introduction
15.2 Explanatory versus Predictive Modeling
15.3 Popular Forecasting Methods in Business
15.4 Time Series Components
15.5 Data Partitioning
PROBLEMS
Chapter 16 Regression-Based Forecasting
16.1 Model With Trend
16.2 Model With Seasonality
16.3 Model With Trend And Seasonality
16.4 Autocorrelation And ARIMA Models
PROBLEMS
Chapter 17 Smoothing Methods
17.1 Introduction
17.2 Moving Average
17.3 Simple Exponential Smoothing
17.4 Advanced Exponential Smoothing
PROBLEMS
PART VII CASES
Chapter 18 Cases
18.1 Charles book Club
18.2 German Credit
18.3 Tayko Software Cataloger
18.4 Segmenting Consumers of Bath Soap
18.5 Direct-Mail Fundraising
18.6 Catalog Cross Selling
18.7 Predicting Bankruptcy
18.8 Time Series Case: Forecasting Public Transportation Demand
References
Index
To our families
Boaz and Noa
Tehmi, Arjun, and in
memory of Aneesh
Liz, Lisa, and Allison
Copyright 2010 by John Wiley & Sons, Inc. All rights reserved
Published by John Wiley & Sons, Inc., Hoboken, New Jersey
Published simultaneously in Canada
No part of this publication may be reproduced, stored in a retrieval system, or transmitted in any form or by any means, electronic, mechanical, photocopying, recording, scanning, or otherwise, except as permitted under Section 107 or 108 of the 1976 United States Copyright Act, without either the prior written permission of the Publisher, or authorization through payment of the appropriate per-copy fee to the Copyright Clearance Center, Inc., 222 Rosewood Drive, Danvers, MA 01923, (978) 750-8400, fax (978) 750-4470, or on the web at www.copyright.com. Requests to the Publisher for permission should be addressed to the Permissions Department, John Wiley & Sons, Inc., 111 River Street, Hoboken, NJ 07030, (201) 748-6011, fax (201) 748-6008, or online at http://www.wiley.com/go/permission.
Limit of Liability/Disclaimer of Warranty: While the publisher and author have used their best efforts in preparing this book, they make no representations or warranties with respect to the accuracy or completeness of the contents of this book and specifically disclaim any implied warranties of merchantability or fitness for a particular purpose. No warranty may be created or extended by sales representatives or written sales materials. The advice and strategies contained herein may not be suitable for your situation. You should consult with a professional where appropriate. Neither the publisher nor author shall be liable for any loss of profit or any other commercial damages, including but not limited to special, incidental, consequential, or other damages.
For general information on our other products and services or for technical support, please contact our Customer Care Department within the United States at (800) 762-2974, outside the United States at (317) 572-3993 or fax (317)572-4002.
Wiley also publishes its books in a variety of electronic formats. Some content that appears in print may not be available in electronic formats. For more information about Wiley products, visit our web site at www.wiley.com.
Library of Congress Cataloging-in-Publication Data:
Shmueli, Galit, 1971-
Data mining for business intelligence: concepts, techniques, and applications in Microsoft Office Excel with XLMiner / Galit Shmueli, Nitin R. Patel, Peter C. Bruce. – 2nd ed.
p. cm.
Includes bibliographical references and index.
ISBN 978-0-470-52682-8 (cloth)
1. Business–Data processing. 2. Data mining. 3. Microsoft Excel (Computer file) I. Patel, Nitin R. (Nitin Ratilal) II. Bruce, Peter C., 1953- III.
Title.
HF5548.2.S44843 2010
005.54–dc22
2010005152
Foreword
Data mining—the art of extracting useful information from large amounts of data—is of growing importance in today’s world. Your e-mail spam filter relies at least in part on rules that a data mining algorithm has learned from examining millions of e-mail messages that have been classified as spam or not spam. Real-time data mining methods enable Web-based merchants to tell you that “customers who purchased x are also likely to purchase y.” Data mining helps banks determine which applicants are likely to default on loans, helps tax authorities identify which tax returns are most likely to be fraudulent, and helps catalog merchants target those customers most likely to purchase.
And data mining is not just about numbers—text mining techniques help search engines like Google and Yahoo find what you are looking for by ordering documents according to their relevance to your query. In the process they have effectively monetized search by ordering sponsored ads that are relevant to your query.
The amount of data flowing from, to, and through enterprises of all sorts is enormous, and growing rapidly—more rapidly than the capabilities of organizations to use it. Successful enterprises are those that make effective use of the abundance of data to which they have access: to make better predictions, better decisions, and better strategies. The margin over a competitor may be small (they, after all, have access to the same methods for making effective use of information), hence the need to take advantage of every possible avenue to advantage.
At no time has the need been greater for quantitatively skilled managerial expertise. Successful managers now need to know about the possibilities and limitations of data mining. But at what level? A high-level overview can provide a general idea of what data mining can do for the enterprise but fails to provide the intuition that could be attained by actually building models with real data. A very technical approach from the computer science, database, or statistical standpoint can get bogged down in detail that has little bearing on decision making.
It is essential that managers be able to translate business or other functional problems into the appropriate statistical problem before it can be “handed off” to a technical team. But it is difficult for managers to do this with confidence unless they have actually had hands-on experience developing models for a variety of real problems using real data. That is the perspective of this book—the use of real data, actual cases, and an Excel-based program to build and compare models with a minimal learning curve.
DARYL PREGIBON
Google Inc, 2006
Preface to the Second Edition
Since the book’s appearance in early 2007, it has been used in many classes, ranging from dedicated data mining classes to more general business intelligence courses. Following feedback from instructors teaching both MBA and undergraduate courses, as well as students, we revised some of the existing chapters as well as covered two new topics that are central in data mining: data visualization and time series forecasting.
We have added a set of three chapters on time series forecasting (Chapters 15–17), which present the most commonly used forecasting tools in the business world. They include a set of new datasets and exercises, and a new case (in Chapter 18).
The chapter on data visualization provides comprehensive coverage of basic and advanced visualization techniques that support the exploratory step of data mining. We also provide a discussion of interactive visualization principles and tools, and the chapter exercises include assignments to familiarize readers with interactive visualization in practice.
In the new edition we have created separate chapters for the k-nearest-neighbor and naive Bayes methods. The explanation of the naive Bayes classifier is now clearer, and additional exercises have been added to both chapters.
Another addition are brief chapter summaries at the beginning of each chapter.
We have also reorganized the order of some chapters, following readers’ feedback. The chapters are now grouped into seven parts: Preliminaries, Data Exploration and Dimension Reduction, Performance Evaluation, Prediction and Classification Methods, Mining Relationships Among Records, Forecasting Time Series, and Cases. The new organization is aimed at helping instructors of various types of courses to choose subsets of topics to teach.
Two-semester data mining courses could cover in detail data exploration and dimension reduction and supervised learning in one term (choosing the type and amount of prediction and classification methods according to the course flavor and the audience interest). Forecasting time series and unsupervised learning can be covered in the second term.
Single-semester data mining courses would do best to concentrate on the first parts of the book, and only introduce time series forecasting as time allows. This is especially true if a dedicated forecasting course is offered in the program.
General business intelligence courses would best focus on the first three parts, then choose a small number of prediction/classification methods for illustration, and present the mining relationships chapters. All these can be covered via a few cases, where students read the relevant chapters that support the analysis done in the case.
A set of data mining courses that constitute a concentration can be built according to the sequence of parts in the book. The first three parts (Preliminaries, Data Exploration and Dimension Reduction, and Performance Evaluation) should serve as requirements for the next courses. Cases can be used either within appropriate topic courses or as project-type courses.
In all courses, we strongly recommend including a project component, where data are either collected by students according to their interest or provided by the instructor (e.g., from the many data mining competition datasets available). From our experience and other instructors’ experience, such projects enhance the learning and provide students with an excellent opportunity to understand the strengths of data mining and the challenges that arise in the process.
Preface to the First Edition
This book arose out of a data mining course at MIT’s Sloan School of Management and was refined during its use in data mining courses at the University of Maryland’s R. H. Smith School of Business and at statistics.com. Preparation for the course revealed that there are a number of excellent books on the business context of data mining, but their coverage of the statistical and machine-learning algorithms that underlie data mining is not sufficiently detailed to provide a practical guide if the instructor’s goal is to equip students with the skills and tools to implement those algorithms. On the other hand, there are also a number of more technical books about data mining algorithms, but these are aimed at the statistical researcher or more advanced graduate student, and do not provide the case-oriented business focus that is successful in teaching business students.
Hence, this book is intended for the business student (and practitioner) of data mining techniques, and its goal is threefold:
1. To provide both a theoretical and a practical understanding of the key methods of classification, prediction, reduction, and exploration that are at the heart of data mining.
2. To provide a business decision-making context for these methods.
3. Using real business cases, to illustrate the application and interpretation of these methods.
The presentation of the cases in the book is structured so that the reader can follow along and implement the algorithms on his or her own with a very low learning hurdle.
Just as a natural science course without a lab component would seem incomplete, a data mining course without practical work with actual data is missing a key ingredient. The MIT data mining course that gave rise to this book followed an introductory quantitative course that relied on Excel—this made its practical work universally accessible. Using Excel for data mining seemed a natural progression. An important feature of this book is the use of Excel, an environment familiar to business analysts. All required data mining algorithms (plus illustrative datasets) are provided in an Excel add-in, XLMiner. Data for both the cases and exercises are available at www.dataminingbook.com.
Although the genesis for this book lay in the need for a case-oriented guide to teaching data mining, analysts and consultants who are considering the application of data mining techniques in contexts where they are not currently in use will also find this a useful, practical guide.
Acknowledgments
The authors thank the many people who assisted us in improving the first edition and improving it further in the second edition. Anthony Babinec, who has been using drafts of this book for years in his data mining courses at statistics.com, provided us with detailed and expert corrections. Similarly, Dan Toy and John Elder IV greeted our project with enthusiasm and provided detailed and useful comments on earlier drafts. Boaz Shmueli and Raquelle Azran gave detailed editorial comments and suggestions on both editions; Bruce McCullough and Adam Hughes did the same for the first edition. Ravi Bapna, who used an early draft in a data mining course at the Indian School of Business, provided invaluable comments and helpful suggestions. Useful comments and feedback have also come from the many instructors, too numerous to mention, who have used the book in their classes.
From the Smith School of Business at the University of Maryland, colleagues Shrivardhan Lele, Wolfgang Jank, and Paul Zantek provided practical advice and comments. We thank Robert Windle, and MBA students Timothy Roach, Pablo Macouzet, and Nathan Birckhead for invaluable datasets. We also thank MBA students Rob Whitener and Daniel Curtis for the heatmap and map charts. And we thank the many MBA students for fruitful discussions and interesting data mining projects that have helped shape and improve the book.
This book would not have seen the light of day without the nurturing support of the faculty at the Sloan School of Management at MIT. Our special thanks to Dimitris Bertsimas, James Orlin, Robert Freund, Roy Welsch, Gordon Kaufmann, and Gabriel Bitran. As teaching assistants for the data mining course at Sloan, Adam Mersereau gave detailed comments on the notes and cases that were the genesis of this book, Romy Shioda helped with the preparation of several cases and exercises used here, and Mahesh Kumar helped with the material on clustering. We are grateful to the MBA students at Sloan for stimulating discussions in the class that led to refinement of the notes as well as XLMiner.
Chris Albright, Gregory Piatetsky-Shapiro, Wayne Winston, and Uday Karmarkar gave us helpful advice on the use of XLMiner. Anand Bodapati provided both data and advice. Suresh Ankolekar and Mayank Shah helped develop several cases and provided valuable pedagogical comments. Vinni Bhandari helped write the Charles Book Club case.
We would like to thank Marvin Zelen, L. J. Wei, and Cyrus Mehta at Harvard, as well as Anil Gore at Pune University, for thought-provoking discussions on the relationship between statistics and data mining. Our thanks to Richard Larson of the Engineering Systems Division, MIT, for sparking many stimulating ideas on the role of data mining in modeling complex systems. They helped us develop a balanced philosophical perspective on the emerging field of data mining.
Our thanks to Ajay Sathe, who energetically shepherded XLMiner’s development over the years and continues to do so, and to his colleagues on the XLMiner team: Suresh Ankolekar, Poonam Baviskar, Kuber Deokar, Rupali Desai, Yogesh Gajjar, Ajit Ghanekar, Ayan Khare, Bharat Lande, Dipankar Mukhopadhyay, S. V. Sabnis, Usha Sathe, Anurag Srivastava, V. Subramaniam, Ramesh Raman, and Sanhita Yeolkar.
Steve Quigley at Wiley showed confidence in this book from the beginning and helped us navigate through the publishing process with great speed. Curt Hinrichs’ vision, tips, and encouragement helped bring this book to the starting gate. We are also grateful to Ashwini Kumthekar, Achala Sabane, Michael Shapard, and Heidi Sestrich who assisted with typesetting, figures, and indexing, and to Valerie Troiano who has shepherded many instructors through the use of XLMiner and early drafts of this text.
We also thank Catherine Plaisant at the University of Maryland’s Human-Computer Interaction Lab, who helped out in a major way by contributing exercises and illustrations to the data visualization chapter, Marietta Tretter at Texas A&M for her helpful comments and thoughts on the time series chapters, and Stephen Few and Ben Shneiderman for feedback and suggestions on the data visualization chapter and overall design tips.
Part One
Preliminaries
Chapter 1
Introduction
1.1 What Is Data Mining?
The field of data mining is still relatively new and in a state of evolution. The first International Conference on Knowledge Discovery and Data Mining (KDD) was held in 1995, and there are a variety of definitions of data mining.
A concise definition that captures the essence of data mining is:
Extracting useful information from large data sets.
(Hand et al., 2001)
A slightly longer version is:
Data mining is the process of exploration and analysis, by automatic or semi-automatic means, of large quantities of data in order to discover meaningful patterns and rules.
(Berry and Linoff, 1997, p. 5)
Berry and Linoff later had cause to regret the 1997 reference to “automatic and semi-automatic means,” feeling that it shortchanged the role of data exploration and analysis analysis (Berry and Linoff, 2000).
Another definition comes from the Gartner Group, the information technology research firm:
[Data Mining is] the process of discovering meaningful correlations, patterns and trends by sifting through large amounts of data stored in repositories. Data mining employs pattern recognition technologies, as well as statistical and mathematical techniques.
(http://www.gartner.com/6_help/glossary, accessed May 14, 2010)
A summary of the variety of methods encompassed in the term data mining is given at the beginning of Chapter 2.
1.2 Where Is Data Mining Used?
Data mining is used in a variety of fields and applications. The military use data mining to learn what roles various factors play in the accuracy of bombs. Intelligence agencies might use it to determine which of a huge quantity of intercepted communications are of interest. Security specialists might use these methods to determine whether a packet of network data constitutes a threat. Medical researchers might use it to predict the likelihood of a cancer relapse.
Although data mining methods and tools have general applicability, most examples in this book are chosen from the business world. Some common business questions that one might address through data mining methods include:
1. From a large list of prospective customers, which are most likely to respond? We can use classification techniques (logistic regression, classification trees, or other methods) to identify those individuals whose demographic and other data most closely matches that of our best existing customers. Similarly, we can use prediction techniques to forecast how much individual prospects will spend.
2. Which customers are most likely to commit, for example, fraud (or might already have committed it)? We can use classification methods to identify (say) medical reimbursement applications that have a higher probability of involving fraud and give them greater attention.
3. Which loan applicants are likely to default? We can use classification techniques to identify them (or logistic regression to assign a “probability of default” value).
4. Which customers are most likely to abandon a subscription service (telephone, magazine, etc.)? Again, we can use classification techniques to identify them (or logistic regression to assign a “probability of leaving” value). In this way, discounts or other enticements can be proffered selectively.
1.3 Origins of Data Mining
Data mining stands at the confluence of the fields of statistics and machine learning (also known as artificial intelligence). A variety of techniques for exploring data and building models have been around for a long time in the world of statistics: linear regression, logistic regression, discriminant analysis, and principal components analysis, for example. But the core tenets of classical statistics—computing is difficult and data are scarce—do not apply in data mining applications where both data and computing power are plentiful.
This gives rise to Daryl Pregibon’s description of data mining as “statistics at scale and speed” (Pregibon, 1999). A useful extension of this is “statistics at scale, speed, and simplicity.” Simplicity in this case refers not to the simplicity of algorithms but, rather, to simplicity in the logic of inference. Due to the scarcity of data in the classical statistical setting, the same sample is used to make an estimate and also to determine how reliable that estimate might be. As a result, the logic of the confidence intervals and hypothesis tests used for inference may seem elusive for many, and their limitations are not well appreciated. By contrast, the data mining paradigm of fitting a model with one sample and assessing its performance with another sample is easily understood.
Computer science has brought us machine learning techniques, such as trees and neural networks, that rely on computational intensity and are less structured than classical statistical models. In addition, the growing field of database management is also part of the picture.
The emphasis that classical statistics places on inference (determining whether a pattern or interesting result might have happened by chance) is missing in data mining. In comparison to statistics, data mining deals with large datasets in open-ended fashion, making it impossible to put the strict limits around the question being addressed that inference would require.
As a result, the general approach to data mining is vulnerable to the danger of overfitting, where a model is fit so closely to the available sample of data that it describes not merely structural characteristics of the data but random peculiarities as well. In engineering terms, the model is fitting the noise, not just the signal.
1.4 Rapid Growth of Data Mining
Perhaps the most important factor propelling the growth of data mining is the growth of data. The mass retailer Wal-Mart in 2003 captured 20 million transactions per day in a 10-terabyte database (a terabyte is 1 million megabytes). In 1950, the largest companies had only enough data to occupy, in electronic form, several dozen megabytes. Lyman and Varian (2003) estimate that 5 exabytes of information were produced in 2002, double what was produced in 1999 (1 exabyte is 1 million terabytes); 40% of this was produced in the United States.
The growth of data is driven not simply by an expanding economy and knowledge base but by the decreasing cost and increasing availability of automatic data capture mechanisms. Not only are more events being recorded, but more information per event is captured. Scannable bar codes, point-of-sale (POS) devices, mouse click trails, and global positioning satellite (GPS) data are examples.
The growth of the Internet has created a vast new arena for information generation. Many of the same actions that people undertake in retail shopping, exploring a library, or catalog shopping have close analogs on the Internet, and all can now be measured in the most minute detail. In marketing, a shift in focus from products and services to a focus on the customer and his or her needs has created a demand for detailed data on customers.
The operational databases used to record individual transactions in support of routine business activity can handle simple queries but are not adequate for more complex and aggregate analysis. Data from these operational databases are therefore extracted, transformed, and exported to a data warehouse, a large integrated data storage facility that ties together the decision support systems of an enterprise. Smaller data marts devoted to a single subject may also be part of the system. They may include data from external sources (e.g., credit rating data).
Many of the exploratory and analytical techniques used in data mining would not be possible without today’s computational power. The constantly declining cost of data storage and retrieval has made it possible to build the facilities required to store and make available vast amounts of data. In short, the rapid and continuing improvement in computing capacity is an essential enabler of the growth of data mining.
1.5 Why Are There So Many Different Methods?
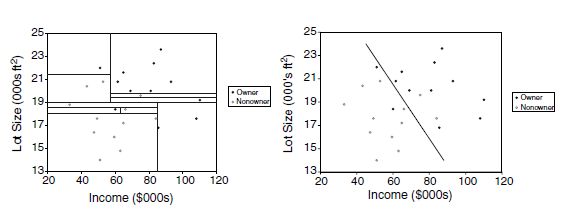
As can be seen in this book or any other resource on data mining, there are many different methods for prediction and classification. You might ask yourself why they coexist and whether some are better than others. The answer is that each method has advantages and disadvantages. The usefulness of a method can depend on factors such as the size of the dataset, the types of patterns that exist in the data, whether the data meet some underlying assumptions of the method, how noisy the data are, and the particular goal of the analysis. A small illustration is shown in Figure 1.1, where the goal is to find a combination of household income level and household lot size that separate buyers (solid circles) from nonbuyers (hollow circles) of riding mowers. The first method (left panel) looks only for horizontal and vertical lines to separate buyers from nonbuyers, whereas the second method (right panel) looks for a single diagonal line.
Different methods can lead to different results, and their performance can vary. It is therefore customary in data mining to apply several different methods and select the one that is most useful for the goal at hand.
FIGURE 1.1 TWO METHODS FOR SEPARATING BUYERS FROM NONBUYERS
1.6 Terminology and Notation
Because of the hybrid parentry of data mining, its practitioners often use multiple terms to refer to the same thing. For example, in the machine learning (artificial intelligence) field, the variable being predicted is the output variable or target variable. To a statistician, it is the dependent variable or the response. Here is a summary of terms used:
Algorithm Refers to a specific procedure used to implement a particular data mining technique: classification tree, discriminant analysis, and the like.
Attribute See Predictor.
Case See Observation.
Confidence Has a specific meaning in association rules of the type “IF A and B are purchased, C is also purchased.” Confidence is the conditional probability that C will be purchased IF A and B are purchased.
Confidence Also has a broader meaning in statistics (confidence interval), concerning the degree of error in an estimate that results from selecting one sample as opposed to another.
Dependent Variable See Response.
Estimation See Prediction.
Feature See Predictor.
Holdout Sample Is a sample of data not used in fitting a model, used to assess the performance of that model; this book uses the term validation set or, if one is used in the problem, test set instead of holdout sample.
Input Variable See Predictor.
Model Refers to an algorithm as applied to a dataset, complete with its settings (many of the algorithms have parameters that the user can adjust).
Observation Is the unit of analysis on which the measurements are taken (a customer, a transaction, etc.); also called case, record, pattern, or row. (Each row typically represents a record; each column, a variable.)
Outcome Variable See Response.
Output Variable See Response.
P (A | B) Is the conditional probability of event A occurring given that event B has occurred. Read as “the probability that A will occur given that B has occurred.”
Pattern Is a set of measurements on an observation (e.g., the height, weight, and age of a person).
Prediction The prediction of the value of a continuous output variable; also called estimation.
Predictor Usually denoted by X, is also called a feature, input variable, independent variable, or from a database perspective, a field.
Record See Observation.
Response usually denoted by Y, is the variable being predicted in supervised learning; also called dependent variable, output variable, target variable, or outcome variable.
Score Refers to a predicted value or class. Scoring new data means to use a model developed with training data to predict output values in new data.
Success Class Is the class of interest in a binary outcome (e.g., purchasers in the outcome purchase/no purchase).
Supervised Learning Refers to the process of providing an algorithm (logistic regression, regression tree, etc.) with records in which an output variable of interest is known and the algorithm “learns” how to predict this value with new records where the output is unknown.
Test Data (or test set) Refers to that portion of the data used only at the end of the model building and selection process to assess how well the final model might perform on additional data.
Training Data (or training set) Refers to that portion of data used to fit a model.
Unsupervised Learning Refers to analysis in which one attempts to learn something about the data other than predicting an output value of interest (e.g., whether it falls into clusters).
Validation Data (or validation set) Refers to that portion of the data used to assess how well the model fits, to adjust some models, and to select the best model from among those that have been tried.
Variable Is any measurement on the records, including both the input (X) variables and the output (Y) variable.
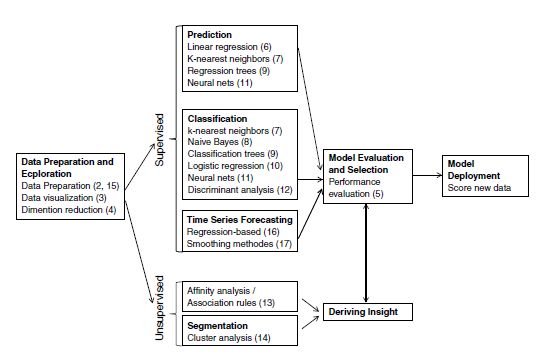
FIGURE 1.2 DATA MINING FROM A PROCESS PERSPECTIVE. NUMBERS IN PARENTHESES INDICATE CHAPTER NUMBERS
1.7 Road Maps to This Book
The book covers many of the widely used predictive and classification methods as well as other data mining tools. Figure 1.2 outlines data mining from a process perspective and where the topics in this book fit in. Chapter numbers are indicated beside the topic. Table 1.1 provides a different perspective: It organizes data mining procedures according to the type and structure of the data.
TABLE 1.1 ORGANIZATION OF DATA MINING METHODS IN THIS BOOK, ACCORDING TO THE NATURE OF THE DATAa
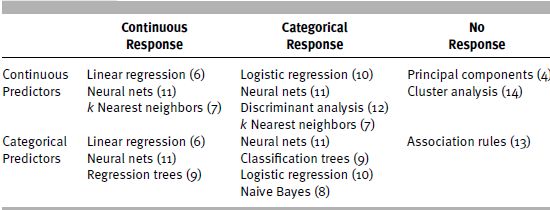
a Numbers in parentheses indicate chapter number.
Order of Topics
The book is divided into five parts: Part I (Chapters 1–2) gives a general overview of data mining and its components. Part II (Chapters 3–4) focuses on the early stage of data exploration and dimension reduction in which typically the most effort is expended.
Part III (Chapter 4) discusses performance evaluation. Although it contains a single chapter, we discuss a variety of topics, from predictive performance metrics to misclassification costs. The principles covered in this part are crucial for the proper evaluation and comparison of supervised learning methods.
Part IV includes eight chapters (Chapters 5–12), covering a variety of popular supervised learning methods (for classification and/or prediction). Within this part, the topics are generally organized according to the level of sophistication of the algorithms, their popularity, and ease of understanding.
Part V focuses on unsupervised learning, presenting association rules (Chapter 13) and cluster analysis (Chapter 14).
Part VI includes three chapters (Chapters 15–17), with the focus on forecasting time series. The first chapter covers general issues related to handling and understanding time series. The next two chapters present two popular forecasting approaches: regression-based forecasting and smoothing methods.
Finally, Part VII includes a set of cases.
Although the topics in the book can be covered in the order of the chapters, each chapter stands alone. It is advised, however, to read Parts I–III before proceeding to the chapters in Parts IV–V, and similarly Chapter 15 should precede other chapters in Part VI.
USING XLMINER SOFTWARE
To facilitate hands-on data mining experience, this book comes with access to XLMiner, a comprehensive data mining add-in for Excel. For those familiar with Excel, the use of an Excel add-in dramatically shortens the software learning curve. XLMiner will help you get started quickly on data mining and offers a variety of methods for analyzing data. The illustrations, exercises, and cases in this book are written in relation to this software. XLMiner has extensive coverage of statistical and data mining techniques for classification, prediction, affinity analysis, and data exploration and reduction. It offers a variety of data mining tools: neural nets, classification and regression trees, k-nearest neighbor classification, naive Bayes, logistic regression, multiple linear regression, and discriminant analysis, all for predictive modeling. It provides for automatic partitioning of data into training, validation, and test samples and for the deployment of the model to new data. It also offers association rules, principal components analysis, k-means clustering, and hierarchical clustering, as well as visualization tools and data-handling utilities. With its short learning curve, affordable price, and reliance on the familiar Excel platform, it is an ideal companion to a book on data mining for the business student.
Installation Click on setup.exe and installation dialog boxes will guide you through the installation procedure. After installation is complete, the XLMiner program group appears under Start>Programs>XLMiner. You can either invoke XLMiner directly or select the option to register XLMiner as an Excel add-in.
Use Once opened, XLMiner appears as another menu in the top toolbar in Excel, as shown in Figure 1.3. By choosing the appropriate menu item, you can run any of XLMiner’s procedures on the dataset that is open in the Excel worksheet.
FIGURE 1.3 XLMINER SCREEN