

WORLD ATLAS OF OIL AND GAS BASINS

This edition first published 2011 © 2011 by John Wiley & Sons Ltd
Wiley-Blackwell is an imprint of John Wiley & Sons, formed by the merger of Wiley’s global Scientific,
Technical and Medical business with Blackwell Publishing.
Registered office: John Wiley & Sons Ltd, The Atrium, Southern Gate, Chichester, West Sussex, PO19 8SQ, UK
Editorial offices: 9600 Garsington Road, Oxford, OX4 2DQ, UK
The Atrium, Southern Gate, Chichester, West Sussex, PO19 8SQ, UK
111 River Street, Hoboken, NJ 07030-5774, USA
For details of our global editorial offices, for customer services and for information about how to apply for permission to reuse the copyright material in this book please see our website at www.wiley.com/wiley-blackwell.
The right of the author to be identified as the author of this work has been asserted in accordance with the UK Copyright, Designs and Patents Act 1988.
All rights reserved. No part of this publication may be reproduced, stored in a retrieval system, or transmitted,
in any form or by any means, electronic, mechanical, photocopying, recording or otherwise, except as permitted by the UK Copyright, Designs and Patents Act 1988, without the prior permission of the publisher.
Designations used by companies to distinguish their products are often claimed as trademarks. All brand names and product names used in this book are trade names, service marks, trademarks or registered trademarks of their respective owners. The publisher is not associated with any product or vendor mentioned in this book. This publication is designed to provide accurate and authoritative information in regard to the subject matter covered. It is sold on the understanding that the publisher is not engaged in rendering professional services. If professional advice or other expert assistance is required, the services of a competent professional should be sought.
Library of Congress Cataloging-in-Publication Data
Guoyu, Li.
World atlas of oil and gas basins / Li Guoyu.
p. cm.
Includes bibliographical references and index.
ISBN 978-0-470-65661-7 (hardcover : alk. paper)
1. Oil fields–Maps. 2. Gas fields–Maps. 3. World atlas. I. Title.
G1021.H8.L5 2011
553.2′80223–dc22
2010040514
A catalogue record for this book is available from the British Library.
This book is published in the following electronic formats: ePDF 9781444390049; Wiley Online Library 9781444390032; ePub 9781444390056
Contents
Editorial Board
About the author
Preface
Foreword
Introduction
The Geological Time Scale
Key to Maps
Part I Overview
1 World Topography
2 World Political Map
3 Geological Map of the Continents
4 World Tectonic Map
5 World Map of Oil and Gas Basins
6 Classification of Oil and Gas Basins by Geometry of Cross-Sections
7 Classification of World Oil and Gas Fields
8 World Map of Oil and Gas Resources
9 Graphs of World Oil and Gas Reserves, Production and Price
10 World Oil Trade
Part II Asian Oil and Gas Basins
11 China
12 North and South Korea
13 Mongolia
14 Japan
15 Burma (Myanmar), Thailand, Laos, Cambodia and Vietnam
16 Malaysia, Singapore and Brunei
17 Indonesia and East Timor
18 Sumatra (Sumatera) Central Basin
19 Philippines
20 Pakistan, Afghanistan, Nepal, Bhutan and Bangladesh
21 India, Sri Lanka and The Maldives
22 Bombay Basin
23 Central Asia: Kazakhstan, Turkmenistan, Uzbekistan,
Tajikistan and Kyrghyzstan
24 Caspian Sea Oil and Gas Region
25 Pre-Caspian Sea Basin
26 North Ustyurt Basin
27 Mangyshlak Basin
28 South Caspian Sea Basin
29 Amur (Kara-Kum) Basin
30 Chu-Sarysu Basin
31 Turgay Basin
32 Fergana Basin
33 Afghan-Tajik Basin
34 Azerbaijan, Georgia, Armenia and Kura Basin
35 Middle East
36 Iran and Iraq
37 Saudi Arabia, Kuwait, Bahrain, Qatar, United Arab Emirates,
Oman and Yemen
38 Persian Gulf Oil and Gas Region
39 Geological Map of the Persian Gulf Oil and Gas Region
40 Syria, Lebanon, Jordan, Cyprus, Palestine and Israel
Part III African Oil and Gas Basins
41 Egypt
42 Libya
43 Sirte Basin
44 Algeria, Morocco and Tunisia
45 Mauritania, Western Sahara, Senegal, Gambia, Mali
and Burkina Faso
46 Guinea, Guinea Bissau and Sierra Leone
47 Liberia, Cote D’ivoire, Ghana, Togo and Benin
48 Niger, Nigeria, Cameroon, Sao Tome and Principe
and Equatorial Guinea
49 Niger Delta Basin
50 Congo, Democratic Republic of Congo and Gabon
51 Zambia, Angola and Malawi
52 Sudan, Central Africa and Chad
53 Muglad Basin
54 Ethiopia, Somalia, Djibouti and Eritrea
55 Kenya and Uganda
56 Tanzania, Rwanda and Burundi
57 Mozambique, Comoros, Madagascar, Seychelles,
Mauritius and Reunion
58 Namibia, Zimbabwe, Botswana, South Africa,
Swaziland and Lesotho
Part IV European Oil and Gas Basins
59 Romania, Serbia, Montenegro, Slovenia, Croatia, Bosnia
and Herzegovina, Hungary, Bulgaria and Macedonia
60 Carpathian Basin
61 Poland, Czech Republic and Slovakia
62 Germany, Luxembourg, Switzerland and Liechtenstein
63 Austria, Italy, Albania, Greece, San Marino and Malta
64 Spain, Portugal and Andorra
65 France, Netherlands, Belgium and Monaco
66 United Kingdom and Ireland
67 Norway, Sweden, Finland, Denmark and Iceland
68 North Sea Oil and Gas Region
69 Estonia, Latvia, Lithuania, Belarus, Ukraine and Moldova
70 Dnept-Donets Basin
71 Russia
72 Oil and Gas Pipelines of Russia and Neighbouring Countries
73 Volga-Urals Basin
74 Timano-Pechora Basin
75 West Siberia Basin
76 East Siberia Basin
77 North Kavkaz Basin
78 Sakhalin Basin
Part V North American Oil and Gas Basins
79 Canada
80 Western Canada Oil and Gas Region
81 USA
82 Los Angeles Basin
83 Rocky Mountain Basins
84 Williston Basin
85 Michigan Basin
86 Mexico Gulf Oil and Gas Region
87 Appalachian Basin
88 Alaska Oil and Gas Region
89 Mexico
90 Tampico Basin
91 Caribbean Sea Region
Part VI South American Oil and Gas Basins
92 Colombia and Ecuador
93 Venezuela, Guyana and Surinam
94 Maracaibo Basin
95 Venezuela East Basin
96 Peru, Bolivia and Paraguay
97 Putumayo Basin
98 Brazil and Uruguay
99 Campos Basin
100 Chile and Argentina
Part VII Australasia and the Poles
101 Australia and Papua New Guinea
102 Gippsland Basin
103 New Zealand, Samoa, Fiji and Tonga
104 Antarctica
105 Arctic Ocean
References
Index of Countries
Index of Basins
The Editorial Board of World Atlas
of Oil and Gas Basins
Chairman
Tang Ke Former Minister of Petroleum Industry, People’s Republic of China
Vice Chairmen
| Zhou Jiping | Vice President, China National Petroleum Corporation (CNPC) |
| Mu Shuling | Former Vice President, China Petroleum and Chemical Corporation (SINOPEC); Academician, Russian Academy of Natural Sciences |
| Fu Chengyu | President, China National Offshore Oil Corporation (CNOOC) |
| Li Guoyu | Professor, Academician, Russian Academy of Natural Sciences; Director of the Oil and Gas Resources Bureau of Former China’s Ministry of Energy |
Advisors
| Lord Browne of Madingley |
President, Royal Academy of Engineering; Managing Partner, Riverstone Europe LLP |
| Elik. M. Khalimov | Former Deputy Minister of Oil, USSR; Academician, Russian Academy of Natural Sciences |
| A.E. Kontorovich | Academician, Russian Academy of Sciences; Director, Institute of Petroleum Geology of Russian Academy of Sciences, Siberia Branch |
| V.I. Vysotsky | Director, Oil and Gas Department, VNII Zarupezhe-geologia, Russia |
Members
| Li Desheng | Academician, Chinese Academy of Sciences; Former Chief Geologist, Research Institute of Exploration and Development, CNPC |
| Tian Zaiyi | Academician, Chinese Academy of Sciences; Former Vice President, Research Institute of Exploration and Development, CNPC |
| Luo Yingjun | Former Vice President, PetroChina; President Assistant, CNPC |
| Jin Zhijun | Deputy Chief Geologist, SINOPEC |
| Xavier Chen | President, Beijing Energy Club |
| Dapo Odesanya | Professor; Director, Andaz Global Solutions, Beijing |
Editorial Staff
Author: Li Guoyu
Maps: Li Guoyu
Text: Li Guoyu
Editorial consultant – English: Dapo Odesanya
Translators: Chen Jiahuang (place names); Liu Qian,
Wei Haifeng (maps 1–10); Shi Jun (basin names);
English proofreaders: Liu Qian, Li Wei, Li Jun, Wang Haiyun, Ren Shuoyi
Index editor: Chen Jiahuang
About the Author:
Professor Li Guoyu
Li Guoyu was born in Lanzhou City, the capital of Gansu Province in northwest China on 17August 1930. He finished his higher education in the Russian Language Department of Lanzhou University in 1952, and furthered his studies at the Beijing Petroleum Geology School in the next year.
Li Guoyu’s professional and academic career has been varied and multifaceted. He was the Vice Director of the Exploration Department of China’s Ministry of Petroleum for many years and has also held the position of Director of the Oil and Gas Resources Bureau of Former China’s Ministry of Energy. His career in the petroleum industry spans over 57 years, during which he was directly involved in the exploration, discovery and development of some of China’s most significant oil and gas fields, including Daqing and Shengli.
Professor Li participated in the efforts of the Chinese authorities to promote international cooperation regarding resources in the world’s continental shelf regions, which was a strategically important objective in an increasingly globalized environment.
One of his most significant achievements, which has become a new and radical school of thought in the petroleum geology field worldwide, is in the field of theoretical research concerning the development of sedimentary basins. A fundamental tenet of his views is the contention that any sedimentary basin must have potential to be oil and gas bearing.
Professor Li’s written output has been prodigious. He has written 84 scholarly works, papers and theses, many of which have been published and have received professional and academic accolades and acknowledgement in countries such as the USA, Russia, UK and France. Professor Li is an Honorary Academician of the Russian Academy of Sciences, and has travelled to 47 countries in pursuit of this work.
A pioneering achievement is an Atlas compendium of the world’s oil and gas basins and fields. This compendium is divided into two parts, the first covering Professor Li’s home country of China and the second dealing with the rest of the world. These two parts were further subdivided into two series of colour Atlases, each comprised of four sections.
China: Vol. I: China Oil and Gas Basins Atlas
Vol. II: China Oil Fields Atlas (Part 1)
Vol. III: China Oil Fields Atlas (Part 2)
Vol. IV: China Gas Fields Atlas
World: Vol. V: World Atlas of Oil and Gas Basins
Vol. VI: World Atlas of Oil Fields (Part 1)
Vol. VII: World Atlas of Oil Fields (Part 2)
Vol. VIII: World Atlas of Gas Fields
Following this impressive effort, Professor Li created a further compendium, this time in the form of a collection of his major papers and thesis. This three-volume series comprise the following categories.
Vol. I: China Petroleum Geology
Vol. II: World Petroleum Geology
Vol. III: Collection of Inspection Reports on World Oil Regions and Areas
A third large-scale series is three volumes of a coloured Atlas.
Vol. I: Atlas of Oil and Gas Basins of China (Second edition)
Vol. II: New World Atlas of Oil and Gas Basins (Parts 1 and 2)
Vol. III: World Atlas of Oil and Gas Basins (English version)
Given his national and international academic stature, Professor Li has been invited as Visiting Professor at many of China’s petroleum universities, as well as at the University of Texas in the USA and the West Siberian University of Russia. He continues to receive invitations to write and present papers on petroleum geology and on his views on sedimentary basin development at international conferences and forums, both in China and around the world.

Preface
When the manuscript of this English edition of World Atlas of Oil and Gas Basins was presented to me I was deeply impressed.
Data on the world’s oil and gas resources do exist in the hands of oil and gas companies and academic institutions. But this is the first time that all the world’s major basins – more than 500 – are presented to the general public in a succinct, reader-friendly format.
Oil and gas have played a critical role in fuelling human progress and will continue to do so in the 21st century. Through the colourful maps and detailed explanatory notes, Professor Li conveys a very important message: the world remains endowed with abundant oil and gas resources. His work shows, in detail, where these resources are located, in various geological structures across five continents and 190 countries.
Only a world-class expert with a long-term career in the oil industry could accomplish such a masterful job. I recently learned of Professor Li’s 57 years of work as a geologist and that the Chinese edition of the book, published a few years ago, was widely acclaimed not only in China but elsewhere.
I know that Professor’s Li’s great wish is to share his work with the global community – hence this first translation of his Atlas into English. This is an admirable ambition, one for which Professor Li should be congratulated.

Lord Browne of Madingley
President, Royal Academy of Engineering
Managing Partner, Riverstone Europe LLP
London, 1st September 2009
Foreword
Professor Li Guoyu is a world famous petroleum geologist, whose many papers and theses have been published in different languages worldwide, including in countries such as the UK and Russia. Professor Li is a familiar and respected figure in the international community of petroleum geologists and oil and gas experts, and he has received justifiable praise for his vast scholarly and research work.
I am extremely pleased that Professor Li will soon publish another substantial work which will be a valuable addition to the world’s store of written knowledge and expertise – the World Atlas of Oil and Gas Basins. This Atlas provides expert overviews and summaries of 507 petroliferous basins and 560 significant oil and gas fields in 190 countries and regions worldwide. In addition to geological and sedimentary data, the Atlas provides important information on the geography of the global oil and gas infrastructure, including major pipelines, refineries, terminals and port facilities.
There have been similar comprehensive works published in Russia in the past, such as the particularly noteworthy work of the Visotsky father and son team during the 1970s and 1980s (Visotsky, 1995; Visotsky et al., 1995). However, Professor Li’s masterly publication with its wide array of maps, diagrams and explanatory notes ushers in a new and important historical phase in the further development of a global collection of integrated atlases.
I have no doubt that this new Atlas will be of critical importance and value to experts, scholars, investors and professional practitioners in the global oil and gas industry. Not only will it exert great influence on the continuing international study of the distribution laws and theories of oil and gas fields, it will also play a significant role in predicting trends in global oil and gas in the 21st century.
I am proud to be associated with this valuable and important publication and I wish my friend and colleague, Professor Li Guoyu future success, more vigorous creativity and good health and a long life of achievement.

A.E. Kontorovich
Academician, Russian Academy of Sciences
July 2009
Introduction
I drew the maps and wrote the various notes contained in this atlas in order to provide a summary of my views on the past, present and future of the world’s oil and gas industry. The World Atlas of Oil and Gas Basins is a culmination of my research and studies on world oil and geology carried out over the past 57 years. The compilation of this atlas has evolved over many years (Li Gouyu, 1982a–c, 1988a,b, 1990a,b, 1991a–d, 1997, 2000, 2009; Kewan Gan et al., 1990; Yongxin Jiang and Yishan Dou, 2003). Although every effort has been made to update individual maps, this has not been possible in all cases. The reader is therefore urged to consult up-to-date international (such as the US Geological Survey World Energy Assessment – http://pubs.usgs.gov/dds/dds-060/) and local databases for more up-to-date information. I am pleased to say that I am optimistic, based on scientific research and theory, about the world’s oil and gas resources for the future. The atlas covers an introduction to world petroleum geology, world oil and gas resources and the development of the global oil industry. This coverage includes the world’s five continents, 190 countries and regions, 507 petroleum basins, as well as 560 large and significant oil and gas fields. The atlas provides what I consider to be a profound analysis and discussion of the past and present of the world oil and gas industry, and most importantly, its future.
Basic premise
According to my views on the development of sedimentary basins, which forms the basis of the atlas, any sedimentary basin must have the potential to be oil and gas bearing. However, each basin is distinct, particularly in respect of the commercial viability of developing and extracting the oil and gas within them. It is my scientific opinion that the world contains abundant oil and gas resources. There are one trillion tons of oil that are discoverable in the approximately 100 million km2 of sedimentary rocks located on Earth. Approximately 70 million km2 of which are distributed on continental landmasses, while the remainder are found under the oceans. In my view more and more large-scale oil and gas provinces will be discovered in the future and therefore the prospects of the industry for the 21st century are excellent. Furthermore, it is my belief that the industry will continue to play a key role in the global energy field well into the 22nd century.
The past
The history of the human race, particularly between 2000 BC and AD 1900, shows a remarkable transition from near-ignorance to a better appreciation of the Earth’s resources and their functional value to human development. Three ancient civilizations – Egyptian, Babylonian and Indian – exploited oil asphalt from surface seepages for construction, lighting and rudimentary medicine production. It was only later that this rare fossil resource came to be exploited for oil production.
Total annual world production was merely 300 tons* in 1857, but then showed dramatic increases to 800,000 tons in 1870, 4 million tons in 1880, 10 million tons in 1890 and 20 million tons in 1900. As of 1900, 8.5 million tons of oil have been produced in the USA, representing 42% of world total. At the same time, Russia produced 10.68 million tons, 52% of the world total. The interesting fact is that these two countries remain the largest oil producers in the world and this reinforces the premise that there are still many large oil and gas provinces to be discovered.
The present
‘The Present’ refers to the whole of the 20th century, which represents a critical historical phase of the development of the global petroleum industry, particularly the 55 years after the end of Second World War. Consider the interesting statistic that worldwide production was a mere 20 million tons in 1900, but reached 3.36 billion tons by 2000, a staggering 164-fold increase over the course of the century. This spectacular growth rate clearly indicates the importance of oil and gas in developing a perspective for future analysis of the global energy industry.
There are five key features of the stages of the development of the global petroleum industry, which can be summarized as follows:
1 Oil and gas fossil fuels and their use in high-efficiency internal combustion engines were important drivers for the rapid human development during the early stages of the 20th century. By the year 2000, oil and gas accounted for 61% of the world’s energy mix.
2 There were multiple significant discoveries of oil and gas provinces in the 20th century including:
| Mexico | 1901 |
| Iran | 904 |
| Venezuela | 1922 |
| Kuwait | 1938 |
| Saudi Arabia | 1940 |
| Baku (Second) | 1948 |
| Daqing (China) | 1959 |
| West Siberia (Russia) | 1960 |
| North Sea Oil | 1969 |
These and other discoveries of oil and gas provinces have laid a solid basis for the development of the global oil industry both for the present and for the future.
3 Economic statistics clearly confirm that the level of a country’s aggregate prosperity is directly proportional to national fuel consumption. Consider the following figures of fuel consumption in some of the world’s major economies in 2000:
| USA | 890 million tons (mt) |
| Japan | 250 mt |
| China | 230 mt |
| Germany | 129 mt |
| Russia | 123 mt |
| France | 94.9 mt |
| Italy | 93.5 mt |
| Britain | 78.9 mt |
In all of these countries, the strong long-term industrial and agricultural bases and rapid sustained economic development were driven by abundant oil and gas resources.
4 Geopolitical competition for oil and gas resources continues unabated and indeed is intensifying. The USA, western Europe, Japan and China are four major oil consuming nations and regions. The competition among them for oil and gas is fierce, and in the case of the USA and western Europe, wars were waged in pursuit of access to these resources.
5 Oil exploration and extraction technologies have flourished. Geological conditions for oil and gas exploration and development are becoming more complicated, but humankind has tackled these challenges with vigorous advancement and enhancement of technologies such as geophysical techniques (e.g. three- and four-dimensional seismic mapping), horizontal drilling technologies and polymer flooding techniques, just to name a few.
The future
Here I refer to the third millennium, the period from the year 2001 to the year 3000. I must start by acknowledging that predicting oil and gas trends for a century is an extremely difficult task. Therefore, predictions for a millennium are unimaginably challenging. However, we may observe some trends from the analysis of oil reserves and production for this period, which are given in Table 1.
Table 1 demonstrates the production potential of the next millennium based on the best data available for reserves by the end of 2004. Based on scientific analysis of the trends of the global world industry I firmly believe the following:
Table 1 World oil production forecast from 2001 to 3000
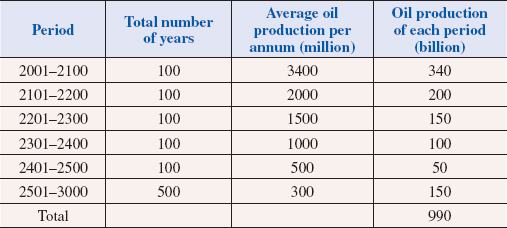
The conclusion is simple and definite: potential oil and gas reserves that are yet to be exploited are massive in scale.
I am indebted to the Chairman, Vice Chairmen and Members of the Editorial Board of the Atlas, as well as to the Advisors for their suggestions for the development of this important publication. I would also like to place on record my gratitude to all the editors and proofreaders. I am particularly grateful to Lord Browne and Dr A.E. Kontorovich for their willingness to write the Preface and Foreword to this Atlas. I wish also to express my appreciation to Mr Wang Junqiao, President of SJ Petroleum Machinery Co., Mr Wang Xun , President of Beijing Conspase Trading Co., Ltd for his strong support and to Mrs Li Wen for her warm help.

Professor Li Guoyu
1st October 2009
* In the atlas SI units of measurement are used (e.g. ton, m, km), but units used for oil and gas reserves and production are often presented differently:
1 ton = 7.3 barrels of oil
1 barrel = 0.137 t
1 m3 = 35.31 ft3 (gas)
1 ft3 = 0.02832 m3
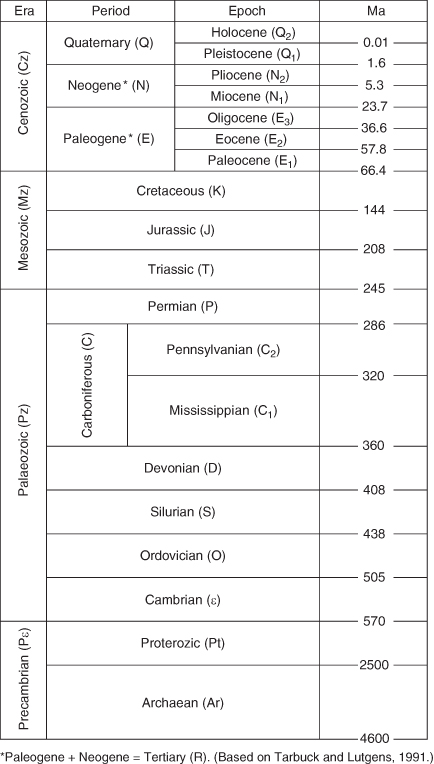
The Geological Time Scale
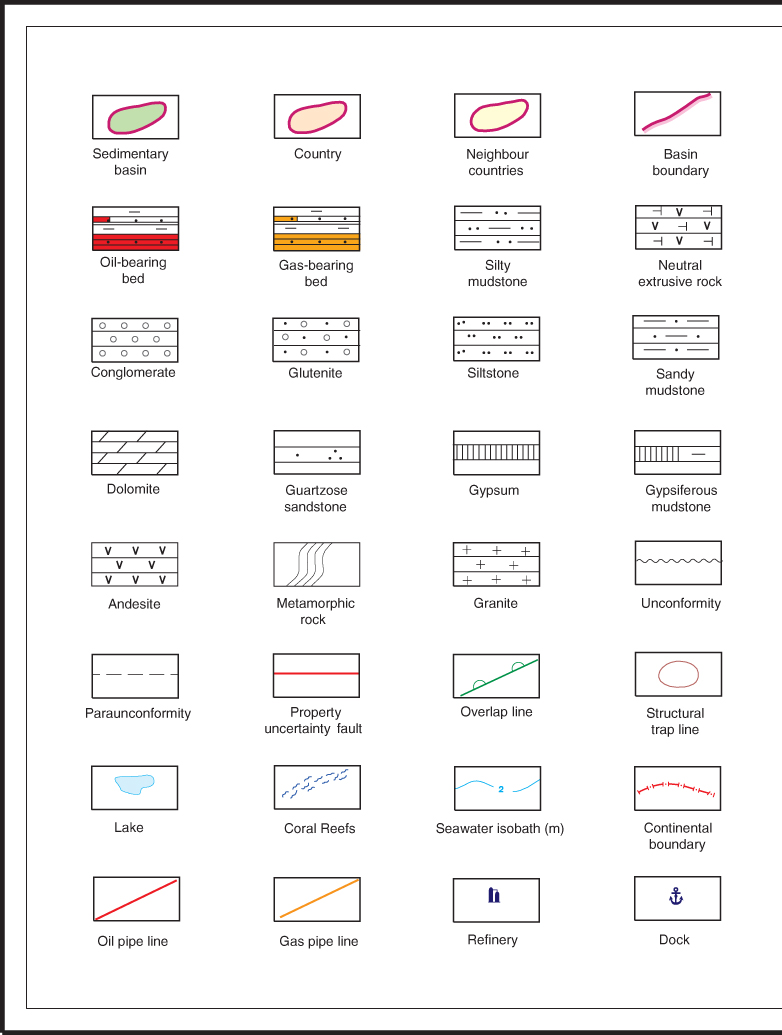
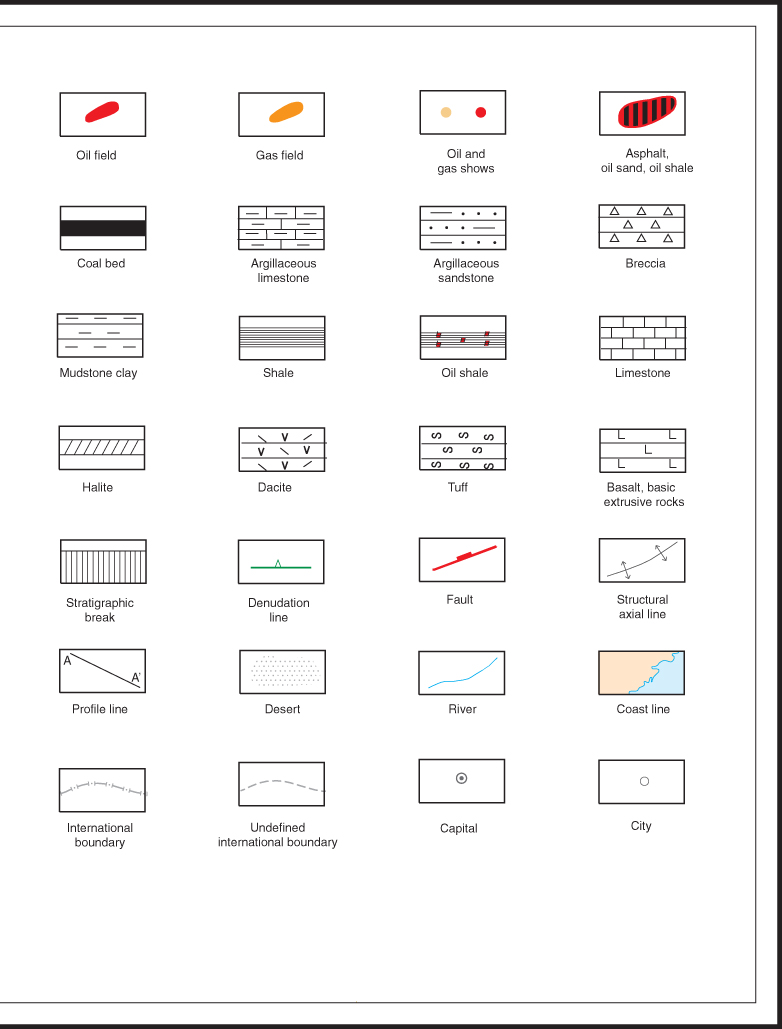
KEY TO MAPS
Part I
Overview
WORLD TOPOGRAPHY CHAPTER 1
1 World Topography
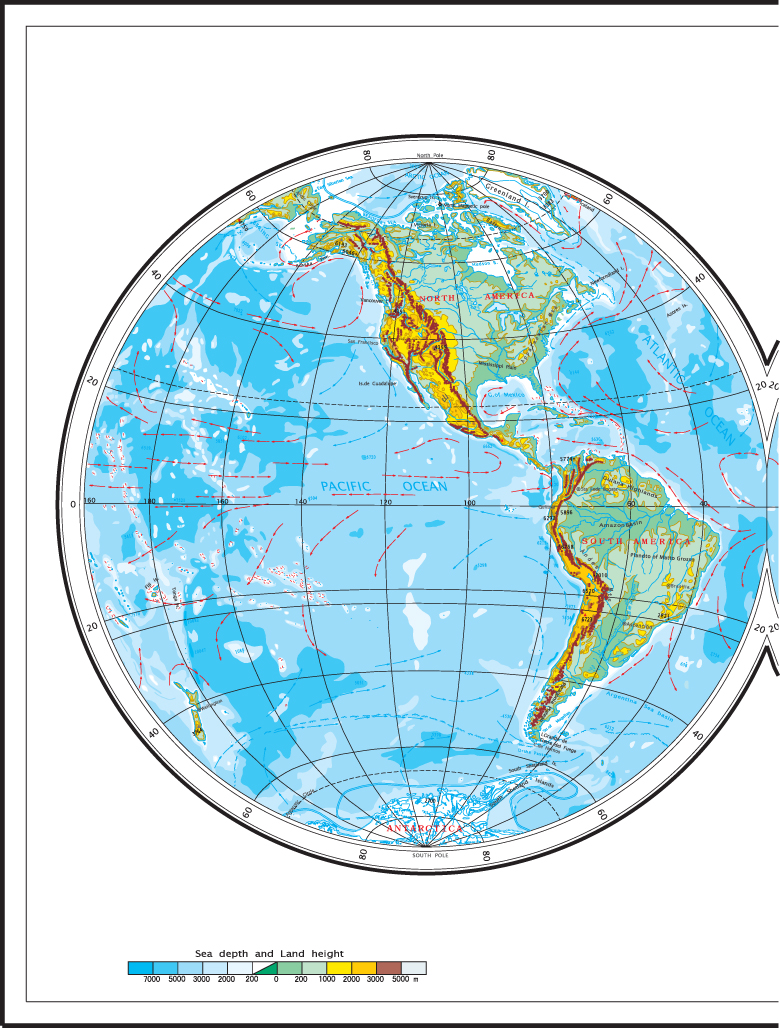
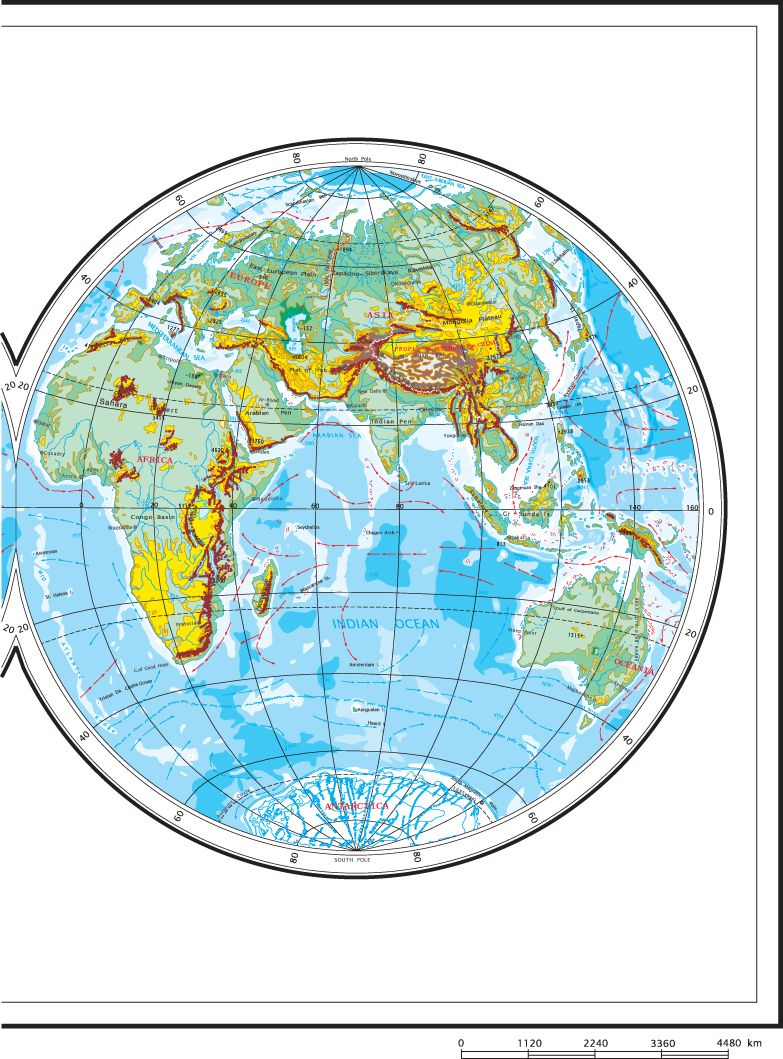
Oceans and continents
Earth has an area of about 510 million km2 (197 million square miles). Of this total, approximately 360 million km2 (140 million square miles), or 71 per cent, are represented by oceans and marginal seas. The continents comprise the remaining 29 per cent, or 150 million km2 (58 million square miles).
Land With an average altitude of about 875 m, land can be classified into continents, islands and peninsula. There are six mainland masses, namely: Eurasia, Africa, North America and South America, Antarctic, and Australia. Islands that are located near each other are called an archipelago.
Oceans Oceans refer to broad and continuous bodies of saline (salty) water on the Earth’s surface. They are 3795 m deep on average. There are four oceans on Earth, namely, the Pacific, the Atlantic, the Indian and the Arctic. Seas are the smaller subdivisions of oceans. The largest sea in the world is the Coral Sea located off northeastern Australia with an area of 4.79 million km2 . Seas can be further divided into marginal seas, inland seas and intercontinental seas. Inland seas refer to those seas that extend onto mainland masses and which may connect with marginal seas or even with oceans by narrow waterways. The Bohai Sea and the Baltic Sea are illustrations of this type. A third common type of sea, the intercontinental, separates two or more continental land masses. The Mediterranean Sea is an example of this type.
Land and submarine topography
Land The surface of the Earth varies greatly in height and morphology. Using these two features as defining parameters, land presents itself in five forms: plains, mountains, plateaus, hills and basins.
A plain is a broad area of land with relatively low relief that has no cliffs at its edges. Plains are mostly less than 200 m in altitude and account for just under 35 per cent of the total land area. The largest plain in the world is the Amazon with an area of about 5.6 million km2 .
Mountains are often spectacular features that rise several hundred metres or more above the surrounding terrain. Mountainous areas have large altitudinal variations, steep slopes and great heights. Linearly extensive mountains are called mountain ranges. Adjacent mountain ranges that share similar genesis are called mountain systems. These ranges are mostly distributed in two main belts in the world. One belt comprises the south–north trending coastlines along both sides of the Pacific Ocean. It runs continuously from the tip of South America through Alaska, to ranges in Asia, the coastlines along Oceania as well as the Pacific Ocean, and islands outside marginal seas. The other is a belt that runs generally in an east–west direction, traversing Asia, southern Europe and northern Africa. This belt includes ranges in Java Island and Sumatra, the Himalayas, the Alps in southern Europe, and the Atlas in northwestern Africa.
Ranges in the above-mentioned belts are typically grand in scope and possess high peaks of above 4000–5000 m. There are 14 peaks with altitude of above 8000 m, most of them are distributed in the Karakorum and the Himalayas Ranges in Asia. Among these peaks, the Qumolangma (Everest) in the Himalayas at an altitude of 8848 m is the highest point in the world.
Plateaus refer to areas with moderately high elevations and relatively flat surfaces and edged by steep cliffs. The world’s highest plateau is China’s Tibetan Plateau with an area of 2.2 million km2 and an average altitude of 4500 m. The world largest plateau in area is the Brazil Plateau (Mato Grosso) in South America. Its area is about 5 million km2 .
A basin is a depression in the landscape, typically below the surrounding area, such as Sichuan Basin in China and the Congo Basin in Africa.
Submarine landforms The Earth’s surface waters tend to obscure the true nature of submarine landforms. It is known that the submarine topography fluctuates as much as the visible landforms above sea level. Submarine topography can be described as consisting of the continental shelf, the continental slope and the ocean floor.
The continental shelf accounts for approximately 7.5 per cent of the Earth’s total sea area. The continental slope is defined as the transitional belt between the continental shelf and the ocean floor. This type of slope is the world’s largest. It has gentle inclines and relatively shallow water depths which would typically be no more than 200 m. There are, however, exceptions of up to 500–600 m. The difference in submarine elevation from the continental shelf to the base of the continental slope is about 3,000 m. The continental slope makes up about 12 per cent of the Earth’s total sea area.
The ocean floor (also known as the seabed) typically refers to the extension of the continental slope and other continental margin features, such as the continental rise below sea level. the ocean floor is the main physical feature of the Earth’s oceans, with depths of between 3000 m and 6000 m. In area, the ocean floor accounts for approximately 80 per cent of the Earth’s total sea area.
Submarine topographical features vary greatly, with several different physical features such as ocean ridges, marine basins, ocean trenches, sea knolls, seamounts, and submarine plateaus, to name just a few.
WORLD POLITICAL MAP CHAPTER 2
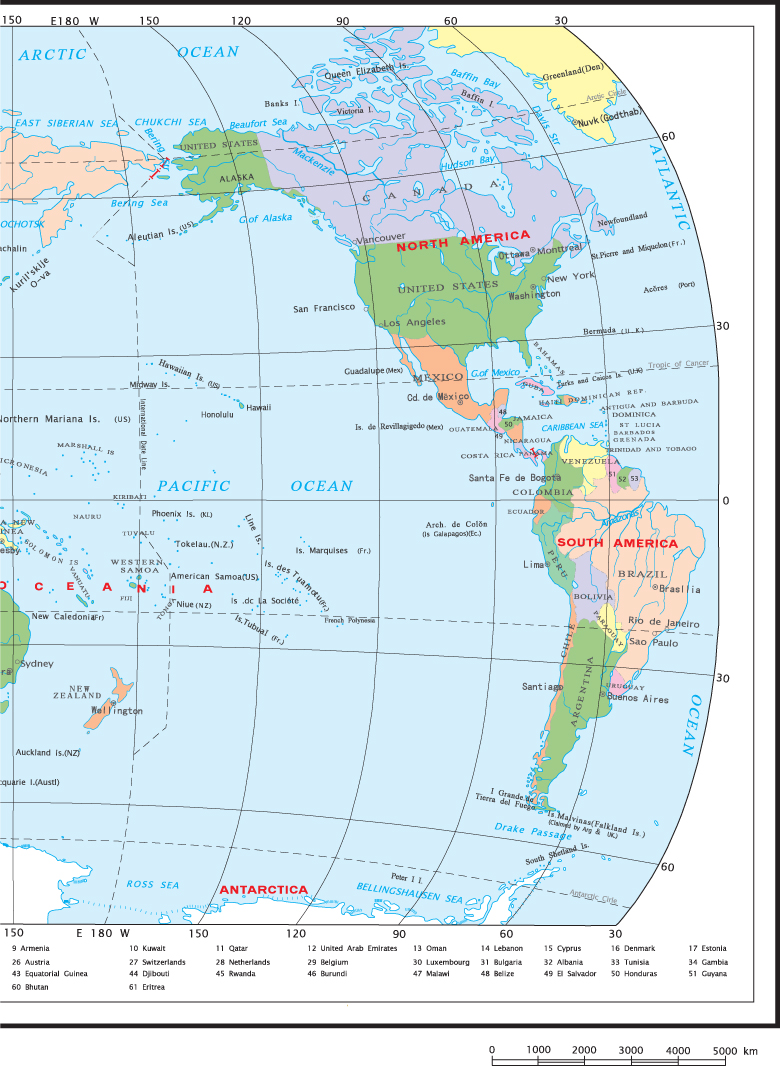
2 World Political Map
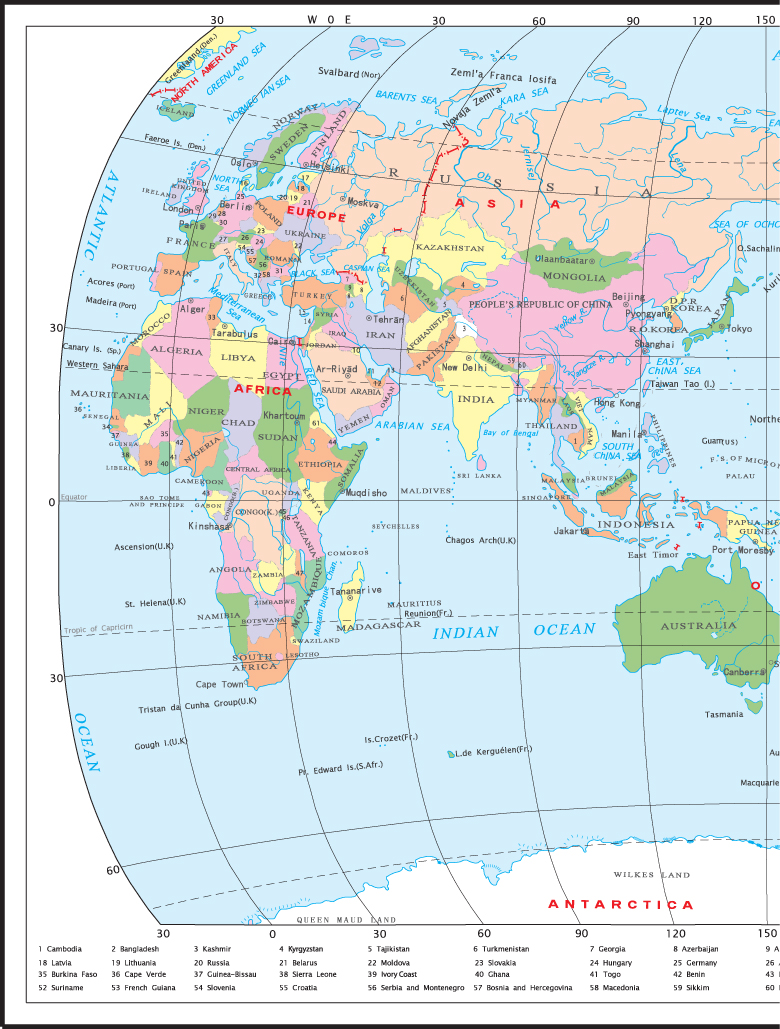
There are 199 countries and regions in the world, but oil and gas is produced in only 90. Oil production exceeds 100 million t per annum in 13 of these countries (Table 2.1), but the majority of these countries produce low amounts of oil. By the end of 2008, only 12 of them played an important role in the world, with their annual production exceeding 100 million t. According to the statistics of 2008, the oil production of these 12 oil-producing countries was, in order of highest output: Russia, 488 million t; Saudi Arabia, 445 million t; USA, 245 million t; Iran, 195 million t; China, 190 million t; Mexico, 140 million t; Canada, 128 million t; United Arab Emirates (UAE), 122 million t; Iraq, 118 million t; Venezuela, 117 million t; Kuwait, 116 million t; and Norway, 108 million t (Grant and Middleton, 1987).
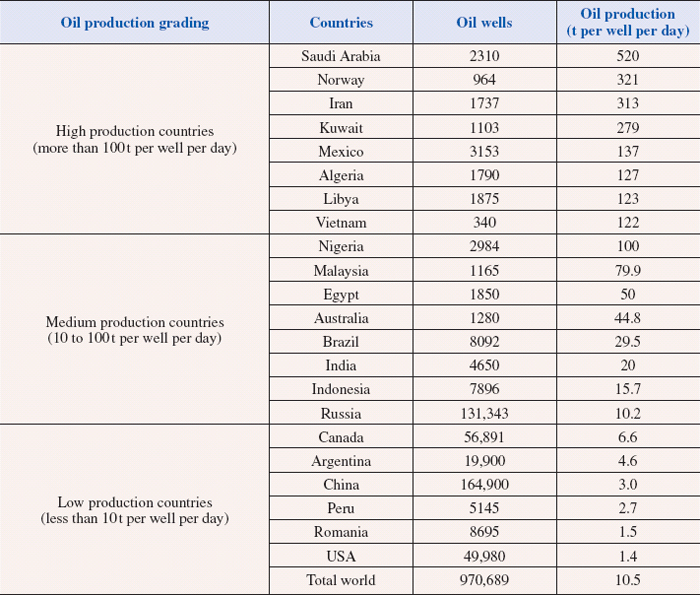
Another statistical method commonly used in the industry is to classify production on a ‘per well per day basis’. This classification provides some insight into the commercial productivity of various geological basins and oil reservoirs. Using this method, oil-producing countries can be classified into three categories: the high production countries with oil production exceeding 100 t, the medium production countries with oil production ranging from 10 to 100 t, and the low production countries with oil production less than 10 t (Table 2.2).
These figures confirm the exceptionally high per-well-production features of Saudi Arabia, Norway and Iran in particular, who are among the leading producers in the world. In marked contrast, other major producers such as Venezuela and Russia rank only among the medium production countries. The most notable low production countries are China, Canada and the USA
These statistics have implications for long-term reservoir depletion and maintenance of reservoir integrity in many cases. However, drawing meaningful general conclusions would be a very difficult task given the wide disparity in production completion technology, production drive mechanisms, production age distribution, geographical location and distribution of individual wells as well as prevailing national field development policies and regulations.
Table 2.1 Classification of 90 oil producers in the world in 2007 (by production)
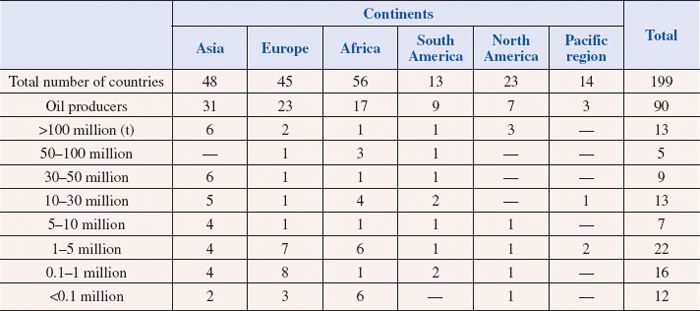
Table 2.2 Oil production per well per day in typical countries in 2007
GEOLOGICAL MAP OF THE CONTINENTS CHAPTER 3
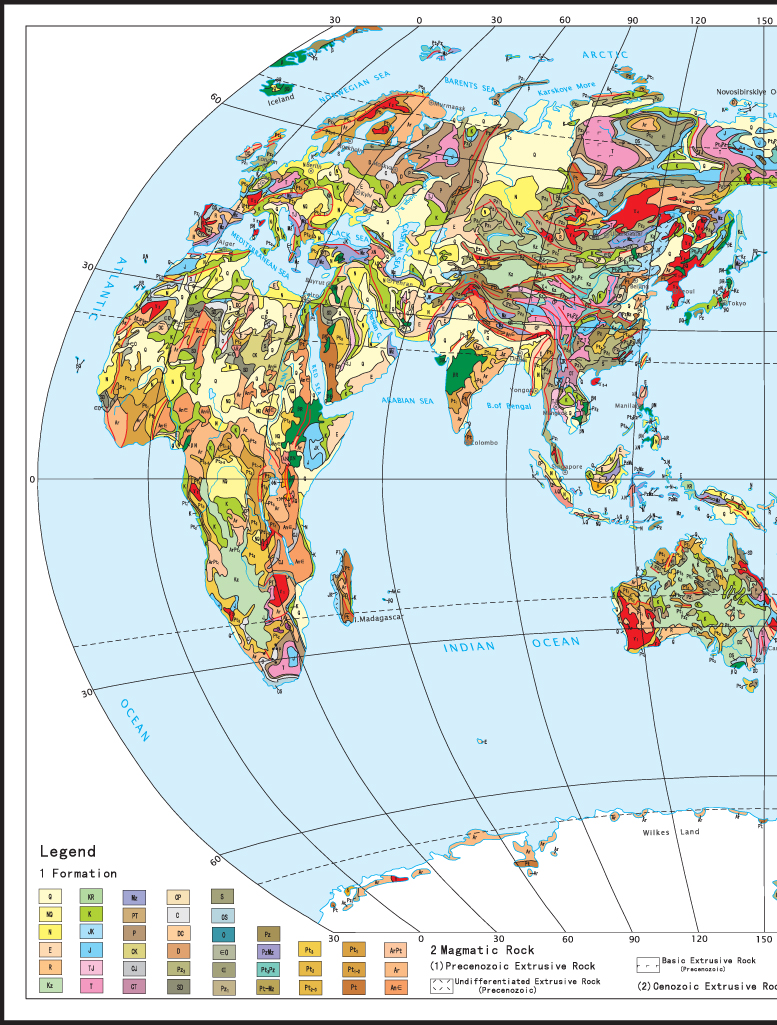
3 Geological Map of the Continents
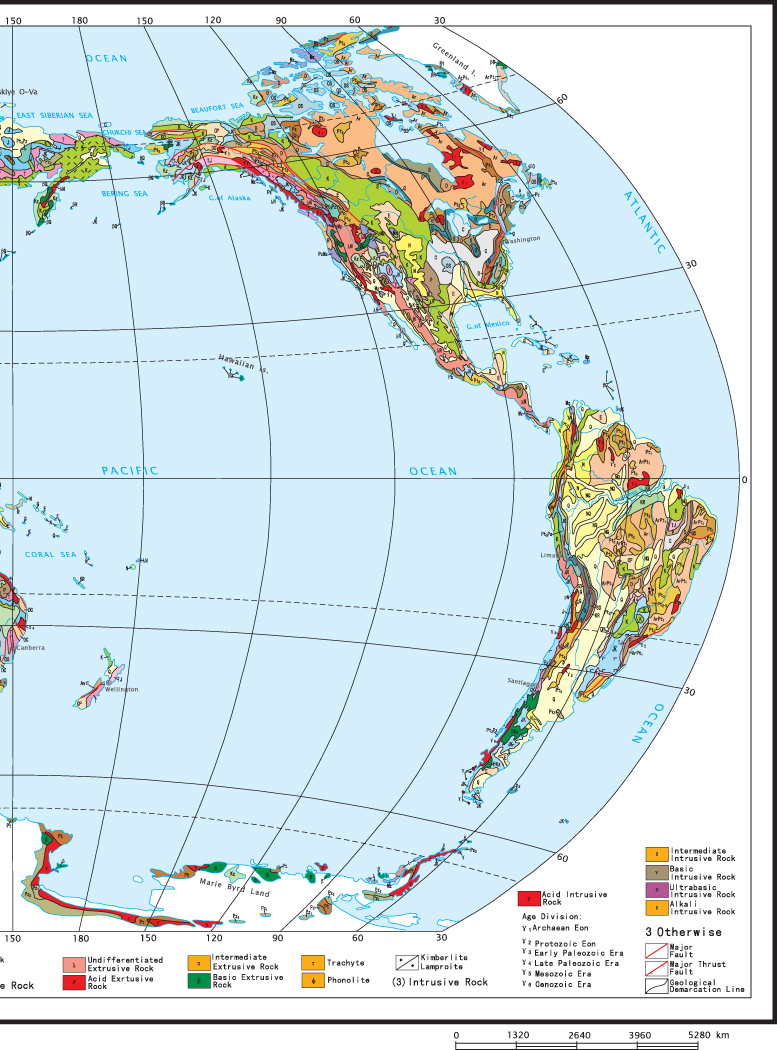
The geological map of the world continents is based on Tarbuck and Lutgens (1995). Sedimentary rocks account for only about of 5 per cent (by volume) of the Earth’s outer 16 km, about 75 per cent of all rocks that crop out on the continents are sedimentary.
Dietz and Holden (1970) have carefully recorded the gross details of the migrations of individual continents over the past 500 million years. By extrapolating plate motion back in time using evidence such as the orientation of volcanic structures left behind on moving plates (e.g. Fig. 3.1), the distribution and movements of transform faults, and palaeomagnetism they were able to reconstruct Pangaea (see Fig. 3.2).
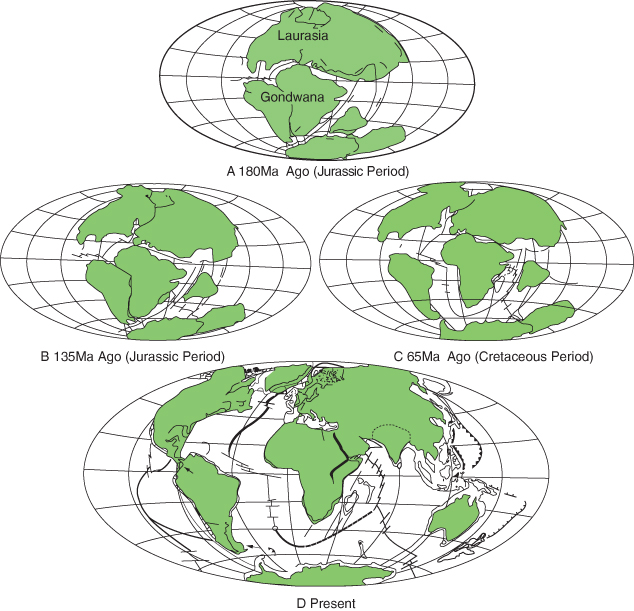
The fragmentation of Pangaea began about 180 million years ago. Figure 3.2 illustrates the breakup and subsequent paths taken by the landmasses involved. As we can see in Figure 3.2A, two major rifts initiated the breakup. The rift zone between North America and Africa generated numerous outpourings of Jurassic age basalts which are presently visible along the eastern seaboard of the USA. Radiometric dating of these basalts indicates that rifting occurred between 180 and 135 million years ago. This date can be used as the birth date of this section of the North Atlantic. The rift that formed in the southern landmass of Gondwanaland developed a ‘Y’-shaped fracture which sent India on a northward journey and simultaneously separated South America–Africa from Australia–Antarctica.
Figure 3.2B illustrates the position of the continents 135 million years ago, about the time Africa and South America began splitting apart to form the South Atlantic. India can be seen halfway into its journey to Asia, and the southern portion of the North Atlantic has widened considerably. By the end of the Cretaceous Period, about 65 million years ago, Madagascar had separated from Africa, and the South Atlantic had emerged as a full-fledged ocean (Figure 3.2C).
The current map (Figure 3.2D) shows India’ in contact with Asia, and the event that began about 45 million years ago created the highest mountains on Earth, the Himalayas, along with the Tibetan Plataeu. By comparing Figures 3.2C and 3.2D, we can see that the separation of Greenland from Eurasia was a recent geological event. Also the recent formation of the Baja Peninsula and the Gulf of California is evident. This event is thought to have occurred less than 10 million years ago.
Fig. 3.1 An interpretation of the geology along the converging Juan do Fuca and American plates in the latitude of Mount Rainier, Washington. (After Cowan et al., 1986.)
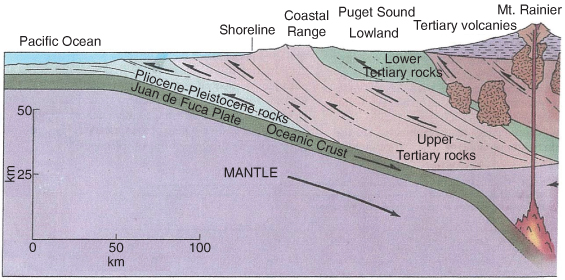
Fig. 3.2 Several views of the breakup of Pangaea over a period of 180 million years according to Dietz and Holden (1970). (Copyright by American Geophysical Union.)
Prior to the formation of Pangaea, the landmasses had probably gone through several episodes of fragmentation similar to what we see happening today. Also like today, these ancient continents moved away from each other only to collide again at some other location. During the period between 500 and 225 million years ago, the fragments of an earlier dispersal began collecting to form the continent of Pangaea. These earlier continental collisions include the Ural Mountains of the Former Soviet Union (FSU) and the Appalachians of North America.
WORLD TECTONIC MAP CHAPTER 4
4 World Tectonic Map
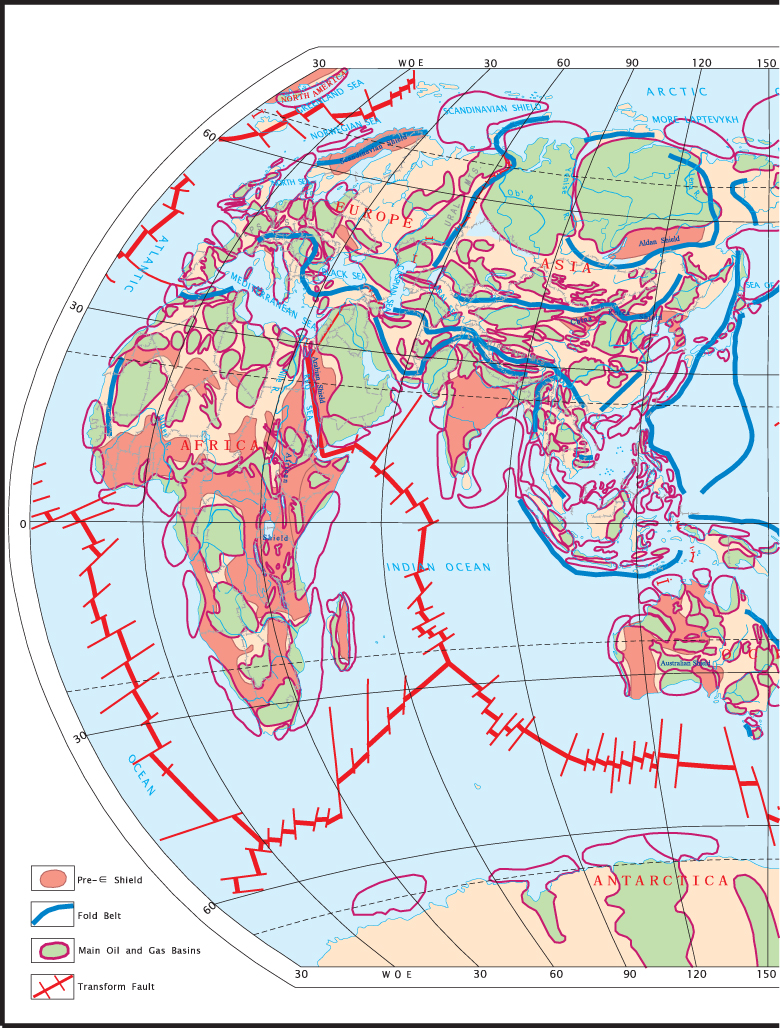
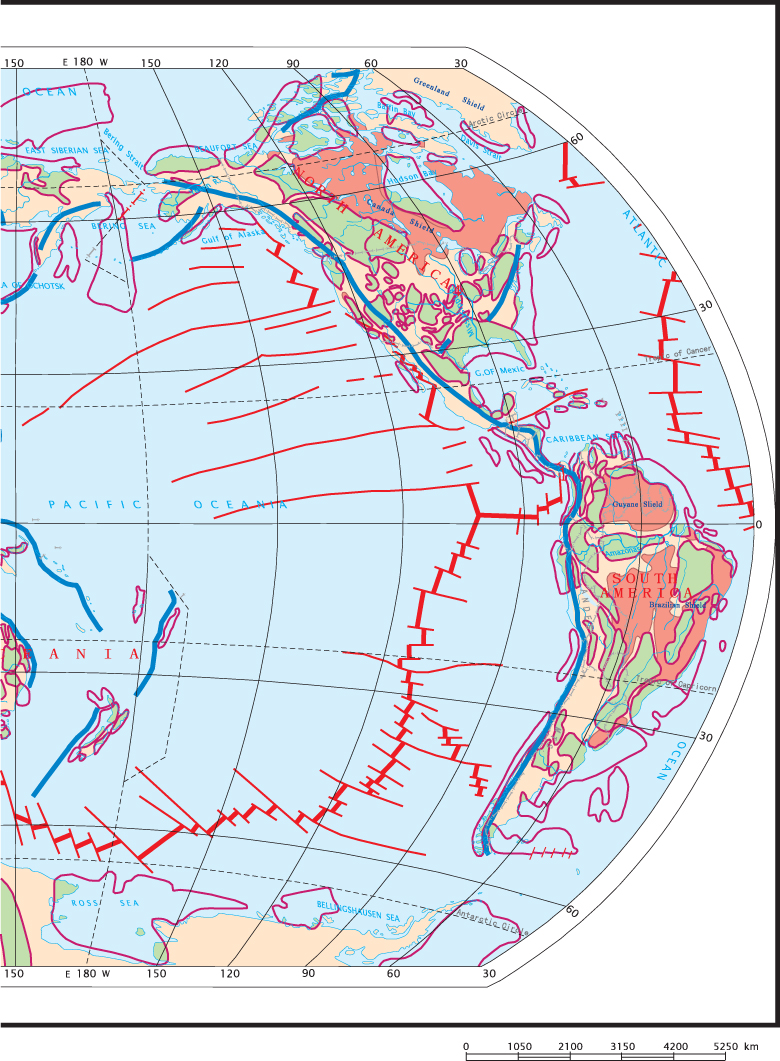
Observed crustal phenomena and the distribution and development of oil and gas basins can be understood in terms of plate-tectonic theory, and in the former geosynclinal approach that it replaced. The general application of plate-tectonic theory has been verified by modern geophysical studies as well as ocean floor investigations and geodetic surveys. However, caution is required because there remain theoretical uncertainties in horizontal plate movement mechanisms and those related to the sinking of continental crust during continental rifting and where plates collide, especially continental–continental plate collisions.
During the evolution of the crust, various states and processes can be recognized, i.e. stable and active areas, continental and oceanic plates, rifting and collision, horizontal and vertical movements, and compression and extension. The culmination of these states and processes is what we observe today on the surface of the Earth. Prevailing concepts recognize four types of regional structures in the world, which are summarized below.
Precambrian cratons
Cratons are large regions of continental crust that have remained tectonically stable over long periods of time, i.e. since the Proterozoic active (fold) belt formed stable parts of continental crust. The outcropping portions of the ancient Proterozoic fold belt are called Shields. On the Asian continent there are the Aldan Shield in eastern Siberia, the China-Korea Shield, the India Shield and the Arabia Shield (linked to the shield in eastern Africa). Africa can be regard as a shield except for its southern and northern ends. In Europe, there are the Baltic Shield, the Ukrainian Shield and the Scandinavian Shield. Oceania has the West Australian Shield. In North America there are the Canadian Shield and the Greenland Shield. South America has the Brazilian Shield and Antarctica has the Antarctica Shield.
Fold belts
The Palaeozoic fold belt is often divided into the Caledonian and the Hercynian tectonic cycles and the Meso-Cenozoic fold belt is often referred to as the Alps cycle.
The Palaeozoic fold belt The Caledonian fold belt is located towards the North Pole, generally around the Arctic Ocean. It winds through northern Greenland to the Franklin fold belt in the Arctic islands of Canada, disappears toward the modern Beaufort Sea and is buried by the coastal basin of the North Pole, only to emerge again in the northern margin of Siberia and along the coast line of northwestern Norway, and finally extends into Scotland and Ireland. The belt is an early Palaeozoic geosyncline affected by intense Caledonia folding, plutonism and metamorphosism.
The east–west Hercynian fold belt that traverses Europe and Asia. It starts from northeast China, winding through Shayan in Mongolia, Yinshan, Tianshan, Kunlunshan and central Asia, then is buried by young sedimentation in the northern Caucasus. The belt in the western sphere is generally in a northeast–southwest direction and roughly coincides with the Appalachian Mountains, with its southwest end being buried by Meso-Cenozoic strata.
A third Palaeozoic fold belt trends east–west and is mainly distributed in the Cape Mountains at the southern end of Africa as well as on the Antarctic continent.
Meso-Cenozoic fold belts In the eastern hemisphere the Tethys fold belt (the name being derived from the former Tethys Sea) is represented by the Alpine–Himalayan fold belt, which starts from the Atlas Mountains in North Africa and Pyrenees Mountains in Europe at its western end, and then crosses the Alpine, Carpathian, Caucasus and Himalayan, mountain ranges. The circum-Pacific fold belt starts in the north from Alaska Bay to the southern end of South America along the Cordillera Central of the east Pacific coast. Its southern part is distributed along the Antarctic Peninsula.
Major petroleum provinces or basins
Examples of the most commonly known of these provinces or basins are listed below by continent (Nakicenovic, 1998).
Asia West Siberian Basin, East Siberian Basin, Karakum Basin, South Caspian Basin, Fergana Basin, Junggar Basin, Tarim Basin, Songliao Basin, Persian Gulf Basin, Central and South Sumatra
Africa Suez, Sirte Basin, Trias, Gefara Basin, Illizi Basin, Niger Delta
Europe North Sea, Dnieper-Donets, Volga-Urals Basin, Caspian
Oceania Cooper, Bowen, Surat, Gippsland, Taranaki
North America Alberta, Permian, Gulf of Mexico
Latin America Maracaibo, East Venezuela, Putumayo
Oceanic areas
These are tectonic units that differ from their continental counterparts. They feature thinner crusts dominated by basalts. The sediments are older with increasing distance from mid-oceanic ridges.
In conclusion, the numerous complicated structural phenomena presently observed at the Earth’s surface can be understood within the basic framework of plate tectonics, especially the fact that petroleum basins are mainly distributed in continental plate settings.
WORLD MAP OF OIL AND GAS BASINS CHAPTER 5
5 World Map of Oil and Gas Basins
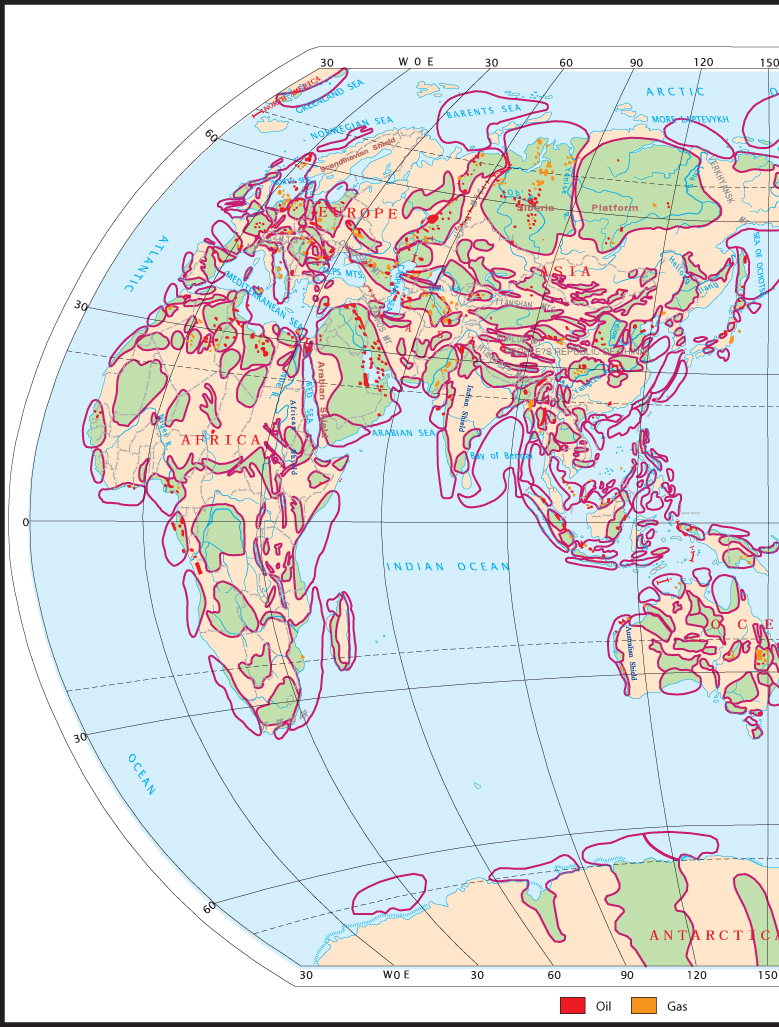
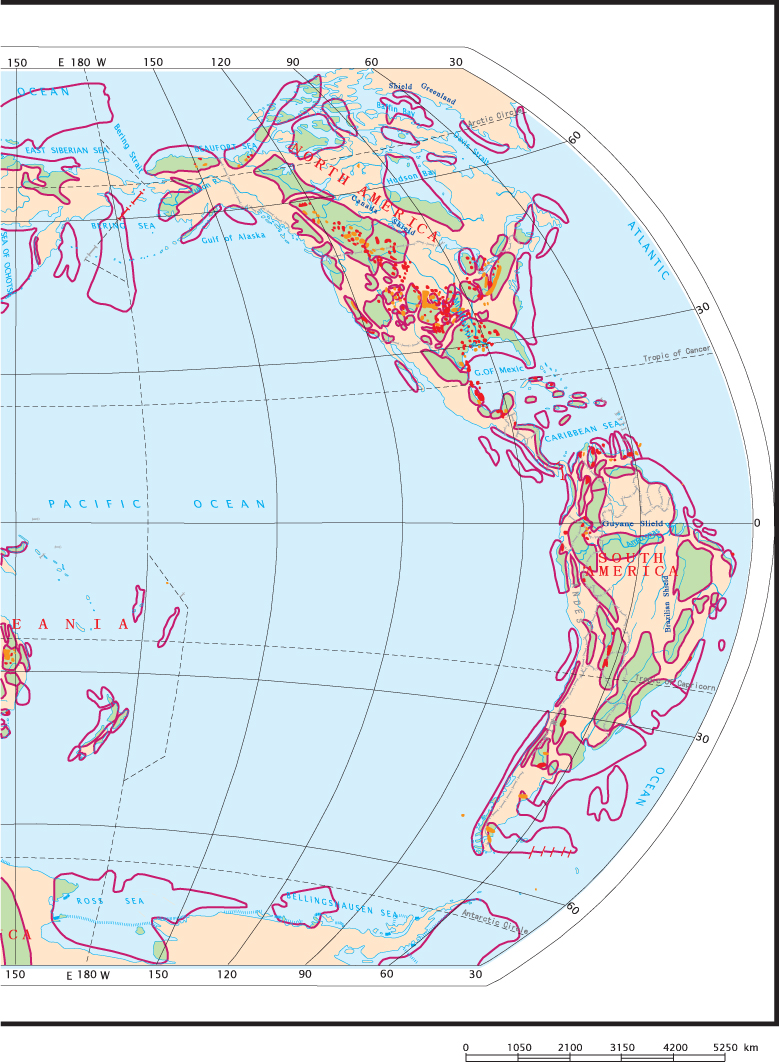
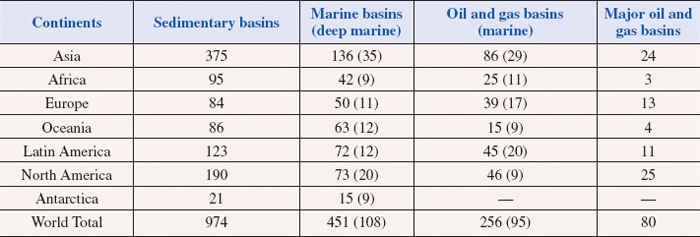
Statistical studies have shown that oil can be discovered in an area of approximately 100 million km2 of sedimentary rocks globally, of which 70 million km2 are distributed on present continental landmasses and 30 million km2 in the present oceans. There is no agreement as to exactly how many petroleum-bearing sedimentary basins there are in the world. Several reasons may be adduced for this lack of consensus, amongst which is the relatively low degree of exploration.
At present, about 200 petroleum basins have been subject to large-scale exploration and development. Worldwide, approximately 67,000 oil and gas fields have been discovered comprising an estimated 41,000 oilfields and some 26,000 gas fields (Table 5.1).
Underpinning this Atlas are the observation-based concepts outlined in Li Guoyu (1996, 2002) regarding the development of sedimentary basins and their potential to be oil- and/or gas-bearing. These views can be summarized as follows:
1 all places on the Earth where downwarping occurs and which are filled with sedimentary rocks can be named sedimentary basins;
2 all sedimentary basins should contain oil and gas;
3 the conceptualization of the development of oil- and/or gas-bearing sedimentary basins depends on characterizing the generation and distribution patterns of hydrocarbons according to the nature of the sedimentary rocks, using the basin as a study unit;
4 within a sedimentary basin, all beds rich in organic matter can act as source rocks, all porous beds as reservoirs, all impermeable beds act as seals, all closed structures as traps for oil and gas, and all intense tectonism as forces to enhance hydrocarbon migration and/or to destroy oil and gas pools;
5 each basin unit comprises sedimentary rocks, organic matter, fluids (oil, gas and water) and geological structures.
Characterization of the development of sedimentary basins and their potential to be oil- and/or gas-bearing includes 14 interdependent lines of investigation deployed in a predetermined sequence.
1 Basin: All crust-downwarped areas with a complete system within itself can be called sedimentary basins, regardless of their size.
2 Sedimentary rocks: The research contents include the general thickness and volume of sedimentary rocks, geochronology, unconformity, lithology.
3 Source rocks: The research contents, based on the theory of organic origin.
4 Reservoir: The research contents lithology, thickness, pores, fractures, vugs, reservoir framework, continuity of occurrence, absence.
5 Seal: All compact rocks can act as seals, such as clay-stone, gypsum, halite and even compact carbonate rich in clay.
6 Fluids (oil, gas and water): Oil and gas are fluid resources, usually associated with water.
7 Migration: The research contents include primary migration and secondary migration.
8 Trap: Traps necessarily consist of 3 components, namely, reservoir, seal and barrier.
9 Oil and gas pools: The research contents include classification, geometry of oil and gas pools, main factors controlling the formation and preservation of oil and gas pools.
10 Destruction: The cause and degree of destruction of formed oil and gas pools.
11 Oil and gas occurrence pattern: This is mainly concerned about the study of the oil and gas occurrence patterns in a single, regional or world basin.
12 Resource appraisal: Resource appraisal and potential reserve calculations in a basin are carried out using the volumetric method, analogue method and concentration method.
13 Basement and edge mountains: Edge mountains are sources of sediment supply for basins.
14 Tectonics: Tectonics is a basic branch, involving the fundamental framework of petroleum geology. It cannot replace all branches in the theory of sedimentary basins.
The sedimentary basins described in the atlas can be considered at the scale of single basins, a country or a region and globally.
Table 5.1 Distribution of sedimentary basins in the world
CLASSIFICATION OF OIL AND GAS BASINS BY GEOMETRY OF CROSS-SECTIONS CHAPTER 6
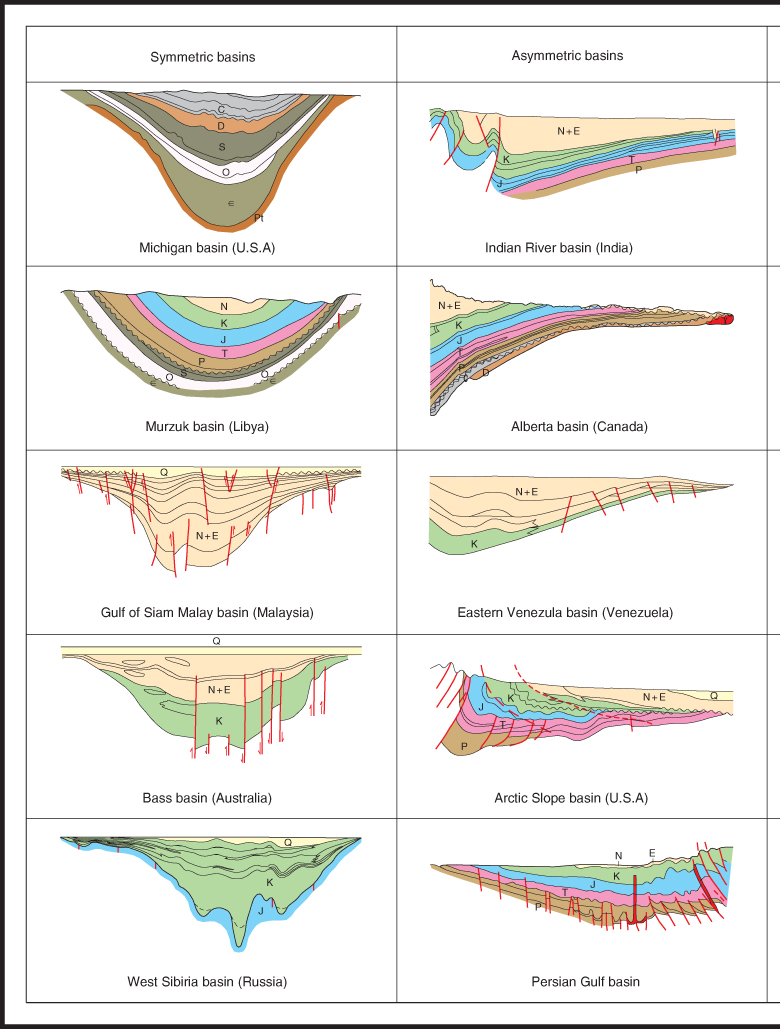
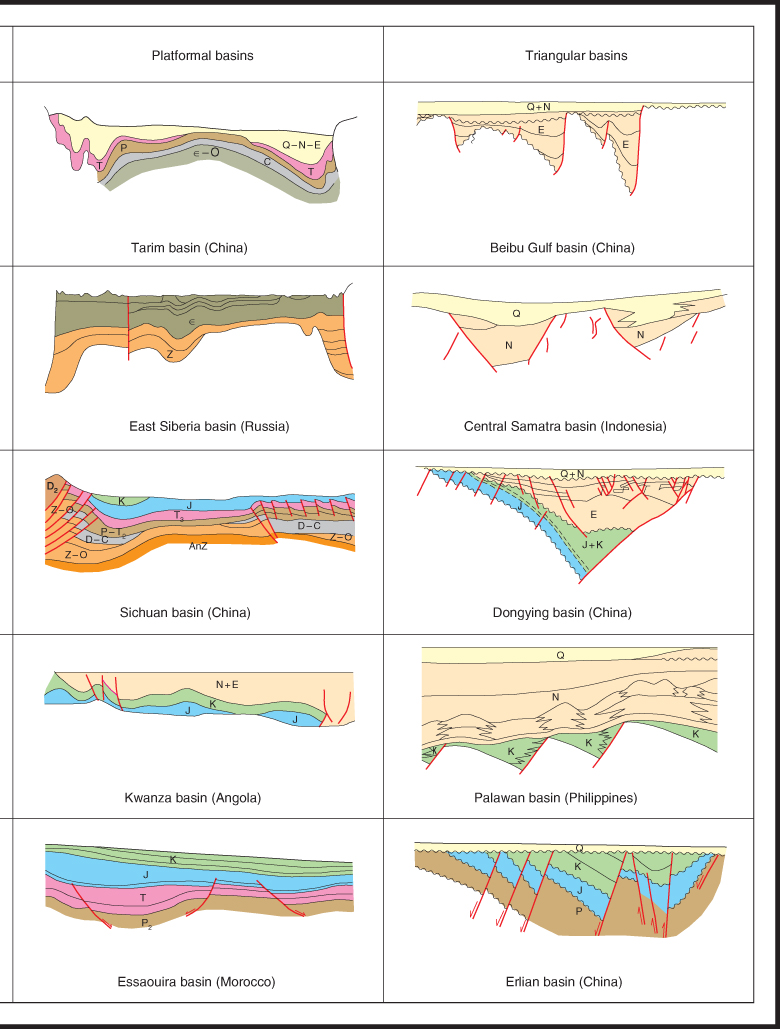
6 Classification of Oil and Gas Basins
by Geometry of Cross-Sections
Generally oil and gas basins are classified by their sedimentary cover, plate-tectonic setting, stress history and subsidence characteristics. Based on subsidence characteristics basins can be divided into fault, depression and fault-depression types. When a section of crust subsides and filled in with sedimentary rocks it will develop its own unique characteristics and a classification method of oil and gas basins therefore can be devised on the basis of the geometry of basin cross-section.
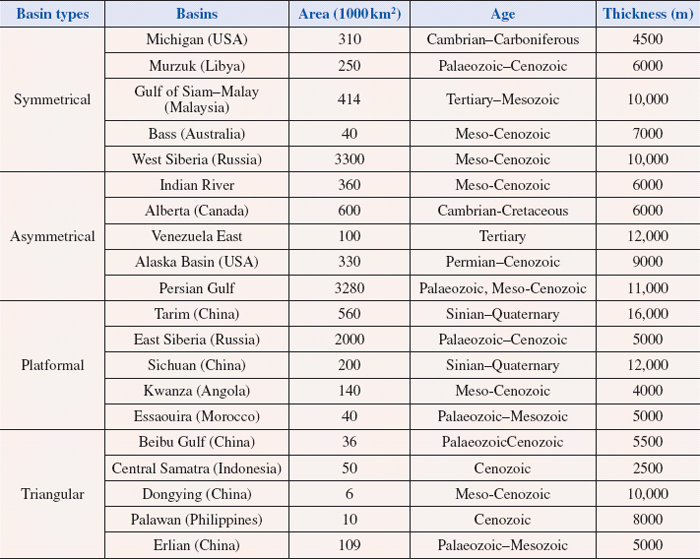
In a sedimentary basin (or a sedimentary rock mass), oil and gas typically migrate from deep high-pressure areas to shallow low-pressure areas. The ultimate distribution is then characterized by the accumulation and settlement of gas, oil and water based on their differing densities. The geometry of a basin depends on tectonic movement, and the distribution pattern of gas, oil and water varies from basin to basin according their different cross-section geometry. Accordingly classification of sedimentary basins can be simplified into four types with the objective of identifying large oil and gas basins. Table 6.1 provides a useful summary of distribution of known sedimentary basins amongst these four types.
Symmetrical basins The West Siberia Basin (Russia) and the Michigan Basin (USA) are classified under this category, with their respective areas being 3,300,000 and 310,000 km2 . Regardless of the structural origin of the basin, oil and gas are mainly distributed in the central part of symmetrical basins, and the richness of the hydrocarbon deposits declines towards the sides as sedimentary rocks become thinner.
Asymmetrical basins The Persian Gulf Basin has an area of 3.2 million km2 , stretching from the Zagros piedmont zone, through the transition zone in Kuwait to the Saudi Arabian Platform. It holds substantial oil and gas reserves, several large oil and gas fields have been discovered in the basin. The Alberta Basin (Canada) ranges from the piedmont zone of the Rocky Mountains in the west to the Canadian Shield in the east. It is also a large and complete oil and gas zone. In addition to the discovery of multiple oilfields, several gas fields have been discovered in the east recently. Oil and gas deposits are distributed in both deep and low layers of the basin. Giant oil and gas fields are distributed in the slope zone of the basement uplift.
Platformal basins Tarim Basin (China) has an area of 560,000 km2 . It is shaped like a platform in the middle and there exist some sags at the periphery of the basin. It is composed of many sags and uplifts and the oil and gas distribution is controlled by giant sags. In addition, oil and gas fields are distributed on the slopes.
Triangular basins This type of basin is very prevalent in China. The extensional basins in East China are all grouped into this category, examples being Jiyang, Dagang, North China, Hailaer, and Beibu Gulf Basins. They feature substantial sedimentary thicknesses and the oil and gas distribution is determined by the extent of the basin.
Table 6.1 Classification of oil and gas basins
