
Table of Contents
Series
Title Page
Copyright
Preface
Chapter 1: Homogeneous Electrode Models and Uniform Corrosion Measurements
1.1 Homogeneous electrodes and traditional electrochemical methods
1.2 Mixed electrodes and uniform corrosion models
Mixed potential theory and electrochemical corrosion measurement
1.4 Electrochemical impedance investigation of an electrode–solution interface
1.5 Electrochemical noise monitoring of rapid electrode processes
1.6 Issues and difficulties in traditional electrochemical methods
References
Chapter 2: Probing Electrode Inhomogeneity, Electrochemical Heterogeneity, and Localized Corrosion
2.1 Probing electrode inhomogeneity
2.2 Probing electrochemical heterogeneity and localized corrosion
2.3 Overview of various techniques for probing localized corrosion
Chapter 3: Visualizing Localized Corrosion Using Electrochemically Integrated Multielectrode Arrays
3.1 An electrochemically integrated multielectrode array: the wire beam electrode
3.2 Visualizing the progression of localized corrosion in an Evans water drop
3.3 Visualizing localized corrosion in nonuniform environments with ion concentration gradients
3.4 Visualizing localized corrosion by a WBE in conjunction with scanning probes
References
Chapter 4: Measuring Thermodynamic and Kinetic Parameters from Localized Corrosion Processes
4.1 Methods of probing localized corrosion thermodynamics and kinetics
4.2 Measuring localized corrosion using the overpotential–galvanic current method
4.3 Measuring localized corrosion using the galvanic current method
4.4 Measuring localized corrosion using the S1–WBE method
References
Chapter 5: Characterizing Inhomogeneity and Localized Corrosion on Coated Electrode Surfaces
5.1 Characterizing inhomogeneities in organic coatings and inhibitor films
5.2 Characterizing inhomogeneity in organic coatings using the WBE method
5.3 The effects of coating inhomogeneity on electrochemical measurement
5.4 Visualizing underfilm corrosion and the effects of cathodic protection
5.5 Studying corrosion protection by coatings and cathodic protection
Chapter 6: Designing Experiments for Studying Localized Corrosion and Its Inhibition in Inhomogeneous Media
6.1 Basic issues in localized corrosion and inhibitor test design
6.2 Fundamental considerations in selecting corrosion measurement techniques
6.3 Designing corrosion tests in highly resistive and inhomogeneous media
6.4 Case studies: Designing crevice corrosion tests by means of a WBE
6.5 Case study: Designing experiments for localized corrosion inhibitor discovery
Chapter 7: Sensing Localized Electrodeposition and Electrodissolution
7.1 Experimental methods for sensing localized electrodeposition and dissolution
7.2 Sensing localized electrodeposition using a WBE
7.3 Sensing localized electrodissolution using a WBE
7.4 Sensing nonuniform electrochemical deposition of organic coatings
Chapter 8: Versatile Heterogeneous Electrode Processes
8.1 Scanning and modeling various heterogeneous electrode processes
8.2 Electrochemical noise generation from electrochemical heterogeneity
8.3 Harvesting electrical power from electrochemical heterogeneity using a WBE
8.4 Further research issues in electrochemical heterogeneity
Index


Copyright © 2013 by John Wiley & Sons, Inc. All rights reserved.
Published by John Wiley & Sons, Inc., Hoboken, New Jersey.
Published simultaneously in Canada.
No part of this publication may be reproduced, stored in a retrieval system, or transmitted in any form or by any means, electronic, mechanical, photocopying, recording, scanning, or otherwise, except as permitted under Section 107 or 108 of the 1976 United States Copyright Act, without either the prior written permission of the Publisher, or authorization through payment of the appropriate per-copy fee to the Copyright Clearance Center, Inc., 222 Rosewood Drive, Danvers, MA 01923, (978) 750-8400, fax (978) 750-4470, or on the web at www.copyright.com. Requests to the Publisher for permission should be addressed to the Permissions Department, John Wiley & Sons, Inc., 111 River Street, Hoboken, NJ 07030, (201) 748-6011, fax (201) 748-6008, or online at http://www.wiley.com/go/permission.
Limit of Liability/Disclaimer of Warranty: While the publisher and author have used their best efforts in preparing this book, they make no representations or warranties with respect to the accuracy or completeness of the contents of this book and specifically disclaim any implied warranties of merchantability or fitness for a particular purpose. No warranty may be created or extended by sales representatives or written sales materials. The advice and strategies contained herein may not be suitable for your situation. You should consult with a professional where appropriate. Neither the publisher nor author shall be liable for any loss of profit or any other commercial damages, including but not limited to special, incidental, consequential, or other damages.
For general information on our other products and services or for technical support, please contact our Customer Care Department within the United States at (800) 762-2974, outside the United States at (317) 572-3993 or fax (317) 572-4002.
Wiley also publishes its books in a variety of electronic formats. Some content that appears in print may not be available in electronic formats. For more information about Wiley products, visit our web site at www.wiley.com.
Library of Congress Cataloging-in-Publication Data:
Tan, Yongjun, 1963–
Heterogeneous electrode processes and localized corrosion / Yongjun Tan.
pages cm. – (Wiley series in corrosion)
Includes bibliographical references and index.
ISBN 978-0-470-64795-0 (hardback)
1. Corrosion and anti-corrosives. 2. Heterogeneous catalysis. 3.
Electrocatalysis. I. Title.
TA418.74.T36 2013
620.1′1223–dc23
2012020902
Preface
Electrochemistry is an enabling science that since Galvani's 1780s experiment on frog legs and Volta's nineteenth-century invention of the battery has facilitated a wide spectrum of scientific discoveries and industrial processes. These include electrolysis, electroplating, metal winning, hydrometallurgy, corrosion prevention, passivation, batteries, fuel cells, solar cells, environmental and biological sensors, organic and inorganic electrosynthesis, electrophoresis, effluent remediation, and neurochemistry. Electrochemical theories and models have also been developed, including the most fundamental relationships, such as Faraday's law, the Nernst equation, and the Bulter–Volmer formulation. However, traditional electrochemistry has a major weakness—there is a “missing link” between its ideal uniform electrode model and practical heterogeneous electrode processes because of the phenomenon of electrochemical heterogeneity.
Electrochemical heterogeneity refers to the localization of chemical and electrochemical reactions over an electrode surface. In electrochemical reactions the reactants do not need to be near each other spatially as normal chemical reactions do; they collide separately with spatially separated electronic conductors. This characteristic permits distinct separation of electrode reactions over an electrode surface, leading to the localization of electrode chemistry, reaction thermodynamics, and kinetics. Most frequently, Electrochemical heterogeneity is initiated from preexisting electrode inhomogeneity (i.e., spatial, physical, compositional, metallurgical, or chemical nonuniformities existing on electrode surfaces). It could also be initiated from an ideally homogeneous surface, especially if the surface were exposed to a nonuniform environment. Electrochemical heterogeneity is a ubiquitous phenomenon that plays critical roles in many difficult but important issues in electrochemical science and engineering, such as localized corrosion, porous electrodeposition, uneven electrodissolution, electrochemical noise, and various forms of dispersion in voltammetry.
Electrochemical heterogeneity has not been confronted effectively in traditional electrochemical science research and has not been covered sufficiently in the electrochemical and corrosion science literature. It is evident that classical theories describing the Faradaic electron transfer processes in dynamic electrochemistry and traditional methods of electrochemical measurement are based on the assumption that the electrode surface is homogeneous. Initial experimental studies used to validate traditional electrochemical theories and methods commonly employed mercury drop electrodes, where a truly homogeneous surface is indeed likely to be achieved. However, solid electrodes that are in practical use today generally have inhomogeneous surfaces, where electrochemical heterogeneity could initiate, propagate, or terminate dynamically. Indeed, there is a major theoretical and technological gap between conventional electrochemistry over uniform surfaces and heterogeneous electrochemistry over inhomogeneous surfaces.
I was first attracted to the issue of electrochemical heterogeneity in 1988 when I was mystified by difficulties in repeating my impedance spectra of coated electrodes. Over the past two decades I have been fortunate to be able to continue my thinking and research on this issue, leading to the development and application of an electrochemically integrated multielectrode array: the wire beam electrode. My colleagues and I have carried out numerous experiments to study a variety of heterogeneous electrode processes. Our experimental findings indicate that electrochemists may need to recognize more widely the fundamental significance of electrode inhomogeneity and electrochemical heterogeneity.
This book is probably the first to focus on electrode inhomogeneity, electrochemical heterogeneity, and their effects on nonuniform electrode processes. Attempts are made to critically review various forms of techniques that have been applied for probing localized electrode–electrolyte interfaces, in particular scanning probe techniques such as the scanning Kelvin probe, the scanning Kelvin probe force microscopy, the scanning vibrating electrode technique, local electrochemical impedance spectroscopy, and scanning electrochemical microscopy. Special attention is focused on localized corrosion experiments designed using the wire beam electrode as a key tool. Case studies presented in this book to illustrate innovative experiments are based primarily on published data with which I have substantial firsthand experience. I acknowledge work by several other research groups that have reported innovative and interesting experiments using various forms of electrode arrays.
I express my sincere thanks to colleagues and co-workers who have collaborated with me over the past two decades, especially (in chronological order) Cuilan Wu, Xuejun Zhou, Shiti Yu, Stuart Bailey, Yadran Marinovich, Brian Kinsella, Alex Lowe, Tie Liu, Naing Naing Aung, Ting Wang, Kim Yong Lim, Bernice Zee, Alan Bond, Chong Yong Lee, Mauro Mocerino, Tristan Paterson, Young Fwu, Kriti Bhardwaj, Bruce Hinton, and Maria Forsyth. I thank them and many other colleagues who have taught me patiently over the years. I also thank my family for giving me encouragement, time, and support throughout the years.
Youngjun Tan
Chapter 1: Homogeneous Electrode Models and Uniform Corrosion Measurements
Electrochemical reaction is a special form of chemical reaction that occurs in reaction devices: that is, electrochemical cells. Since Galvanis' 1780's experiment on frog legs and Volta's nineteenth-century invention of the voltaic pile, numerous types of electrochemical cells, such as batteries, fuel cells, solar cells, galvanic cells, and electroplating and electrowinning baths, have been invented by electrochemists, facilitating a wide spectrum of industrial processes and scientific discoveries. Many electrochemistry-based technologies, including electrolysis, electrosynthesis, electrocatalysis; electroplating, metal winning, hydrometallurgy, electrophoresis, effluent remediation, electrochemical energy conversion and storage, cathodic and anodic protection, and environmental, biological, and corrosion sensors, have been developed for various industrial applications. Electrochemistry also provides a theoretical basis for understanding and explaining natural phenomena in scientific fields such as corrosion science and neurochemistry.
Fundamentally, electrochemical cells are based on two basic electrochemical devices: the galvanic cell (Figure 1.1a) and the electrolytic cell (Figure 1.1b). All electrochemical cells consist of an anode, a cathode, an electrically conductive path, and an ionically conductive path. Electrodes are basic components that provide the interface between an electronic conductor, usually a metal, and an ionic conductor, usually an electrolytic solution.
Figure 1.1 Basic electrochemical devices.

Electrochemical reactions in a galvanic or electrolytic cell always involve two half-cell reactions occurring simultaneously over separated anode and cathode surfaces. Anodic oxidation reactions occur at the anode–solution interface across which species lose electrons, while cathodic reduction reactions occur at the cathode–solution interface across which species gain electrons. The mass transfer, chemical reaction, and physical state change are the sequential steps of electrochemical processes occurring at the anodic and cathodic half-cells. In a galvanic cell (Figure 1.1a), electrochemical reactions occur spontaneously at the anodes and cathodes when they are connected externally by a conductor. Galvanic cells are often employed as batteries and fuel cells to convert chemical energy into electrical energy. A galvanic cell also provides a starting point for the development of metal corrosion theories and corrosion prevention technologies. In an electrolytic cell (Figure 1.1b), electrochemical reactions are driven by the imposition of an external voltage greater than the open-circuit potential of the cell. Electrolytic cells are widely employed in such industrial processes as electrolysis, metal winning, electroplating, and cathodic protection.
An electrochemical reaction is a chemical reaction in nature, and therefore all factors affecting normal chemical reactions, such as the chemical nature of reactants, the concentrations of the reactants, the temperature, the ability of reactants to come into contact with each other, and the availability of rate-accelerating or rate-decelerating agents, affect electrochemical reactions. However, it should be pointed out that there is a fundamental difference between normal chemical reactions and electrochemical reactions. An electrochemical reaction occurs at the electrode–solution interface, often driven by voltage applied externally. In an electrochemical reaction the reactants do not need to be near each other spatially as normal chemical reactions do; they collide individually with spatially separated anodes and cathodes. For this reason, electrochemical reactions are affected significantly by the structure and property of electrode–solution interfaces, movements of ions and electrons between electrodes, and the voltage applied externally.
In this chapter we provide an overview of models illustrating homogeneous electrode–solution interfacial structure and theories describing electrode processes with and without the effects of voltage applied externally. Particular focus is on a mixed electrode model that explains uniform corrosion. Electrochemical and corrosion principles are reviewed; however, a detailed description of traditional electrochemical and corrosion theories is not attempted because these have already been discussed by many authors, among them Bard and Faulkner [1], Bockris et al. [2], Fontana [3], Mansfeld [4], and Evans [5]. Attempts are made to discuss limitations in traditional electrochemical methods and factors that may cause a change from a uniform corrosion mechanism to a localized form, leading to the concepts of electrode inhomogeneity and electrochemical heterogeneity.
Carbon dioxide (CO2) corrosion of iron in sodium chloride (NaCl)-containing solutions under ambient temperature and atmospheric pressure conditions is used as a case to illustrate typical uniform corrosion processes occurring in practical industrial systems. Electrochemical measurements are described through their applications in investigating the rates and interfacial structures of steel electrodes in CO2 corrosion environments, with and without the present of corrosion inhibitors.
Electrochemical reactions occur at the interface of an electrode and a solution. Knowledge of the structure and property of an electrode–solution interface is critical for understanding electrochemical reactions and their thermodynamics and kinetics. It is well known that the electrode–solution interface is affected by electrode surface roughness and scratches, impurities, mill scales, surface flaws, metallurgical defects, precipitated phases, grain boundaries, dislocation arrays, localized stresses, selective dissolution, and damage to passive films. It is also understood that an electrode–solution interface is affected by factors such as surface chemical adsorption and desorption, mass transfer, and liquid flow. However, unfortunately, direct observation of an electrode–solution interface is very difficult, if not impossible. Instead, theoretical models are employed to help in addressing issues relating to the structure, properties, and reactivity of an electrode–solution interfacial region and its components.
Figure 1.2 is a simplified model of a conventional uniform electrode–solution interface. In this model it is assumed that an electrochemical double layer exists in the vicinity of an electrode surface, consisting of inner and outer Helmholtz layers. It is also assumed that the electrode surface is chemically and electrochemically homogeneous and that electrode reactions are distributed uniformly over the electrode surface.
Figure 1.2 Simplified electrode–solution interface model.
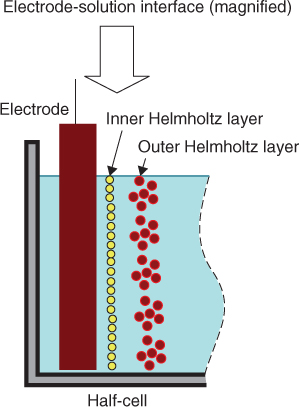
This homogeneous electrode–solution interface model significantly simplifies the analysis of electrochemical processes. Under this homogeneous electrode assumption, electrochemical properties at any location of an electrode surface can be considered to be identical to that of the entire electrode surface. For example, it allows the application of Faraday's law of electrolysis [1] to determine the thickness of electrodeposits because electrodeposition current can be considered as being uniformly distributed over an electrode surface. This assumption is also employed as a prerequisite for fundamental electrochemical thermodynamic and kinetic relationships, including the Nernst equation and the Bulter–Volmer formulation and also for traditional electrochemical methods such as electrode potential and polarization measurements [1–5].
This electrode–solution interface model is applicable to both the anode and cathode of a galvanic cell or an electrolytic cell. In a galvanic cell, such as the iron corrosion cell shown in Figure 1.1a, actual reactions occurring at its anodic and cathodic interfaces are determined by the electrochemical thermodynamics of chemical species in the cell. Electrode potential is a thermodynamic parameter that reveals the tendency of a chemical species to be reduced in an electrochemical reaction. Figure 1.3 illustrates a traditional setup for determining the standard reduction potential of an iron electrode in 1.00 M Fe2+ solution using a standard hydrogen reference electrode and a high-resistance voltmeter. This laboratory method determines the reduction potential of 1.00 M Fe2+ against the reduction potential of 1.00 M H+. Under standard conditions this value would be − 0.44 V, indicating a lower tendency of 1.00 M Fe2+ to be reduced than 1.00 M H+. For this reason, in this system, H+ would be reduced, H+ + 2e− → H2, while Fe would be forced to oxidize, Fe → Fe2+ + 2e−. As a consequence, iron corrodes in the galvanic cell.
Figure 1.3 Electrode potential measurement.
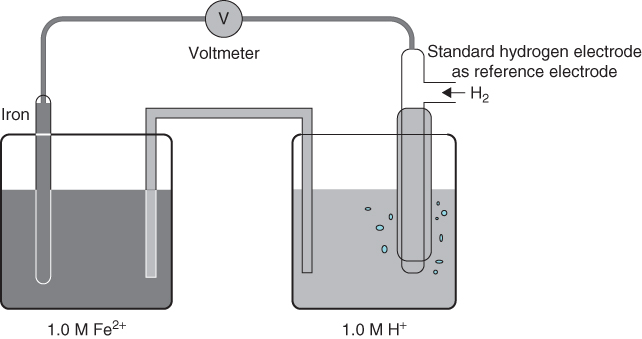
The potential measured using the experimental setup shown in Figure 1.3 is a reversible equilibrium potential of the half-cell electrode reaction, Fe2+ + 2e− ⇔ Fe. This electrode potential can be related to the fundamental electrode thermodynamic equation, the Nernst equation [equation (1.1)], which gives an electrode potential for any reversible half-cell reaction, Ox + ne − ⇔ Red, as a function of nonstandard ionic concentrations:
1.1 
where E is the nonstandard half-cell reduction potential of interest, Eo the standard half-cell reduction potential, [Ox] the concentration of oxidant Ox, [Red] the concentration of reductant Red, F is Faraday's constant, R the universal gas constant, T the absolute temperature, and n the number of electrons transferred in the reaction.
For an iron electrode reaction, Fe2+ + 2e− ⇔ Fe, the Nernst equation gives the relationship between its reduction potential and the Fe2+ concentration:
1.2 
The potential measurement method illustrated in Figure 1.3 is valid only under the assumption that the iron electrode–solution interface is homogeneous, and therefore that the iron electrode potential measured can be considered to be equal to the potential at any location of the iron electrode surface. This homogeneous electrode assumption is also essential for the relationship in equation (1.2) because the Nernst equation is valid only when the concentration of Fe2+ is distributed uniformly over the electrode–solution interface, and therefore the electrode potential calculated can be considered to be equal to the potential at any location of the iron electrode surface.
Classical theory describing the kinetics of Faradaic electron transfer processes in dynamic electrochemistry is also based on this homogeneous electrode–solution interface model. The most fundamental electrode reaction kinetic relationship, the Bulter–Volmer equation [1, 6, 7], is used to describe the kinetics of anodic and cathodic half-cell reactions:
1.3 
where η is the overpotential ( = E − Eeq), the amount by which a potential deviates from equilibrium potential; i the measured or applied current density; io the exchange current density, F is Faraday's constant, R the universal gas constant, T the absolute temperature, n the number of electrons transferred in the reaction, and α and β are anodic and cathodic charge transfer coefficients that are related to the potential drop through the electrochemical double layer.
The Bulter–Volmer equation suggests that the kinetics of an electrochemical reaction depends on various factors, including overpotential and exchange current density. Positive overpotentials enhance oxidation reactions on the electrode, whereas negative overpotentials induce reduction reactions to occur. For a given overpotential, the magnitude of reaction current flow is affected particularly by the charge transfer rate between solution species and the electrode. The charge transfer rate is a key parameter indicating the kinetics of an electrochemical reaction. It is usually measured by the exchange current density, io, using the electrochemical polarization measurement setup shown in Figure 1.4.
Figure 1.4 Experimental setup for polarization measurement.

In polarization measurements, a potentiostat is used to perturb the working electrode by injecting or extracting electrons to or from the electrode, causing the electrode potential to change from its equilibrium potential Eeq to a new electrode potential, E. The overpotential, η = E − Eeq, is a response to the applied current, which can be adjusted to any value desired. The electrode potential can be measured using a voltmeter and a reference electrode, while the applied current can be measured using a zero-resistance ammeter. The measured potential vs. current (or log i) data are usually presented as polarization curves. Experimental polarization curves contain information on electrode reaction kinetics and factors affecting electrochemical processes and mechanisms.
Apparently, the Butler–Volmer equation and the polarization measurement are also based on the assumption that an electrode–solution interface is homogeneous and therefore that electrode potential and currents can be considered to be distributed uniformly over the electrode surface. It should also be noted that the Butler–Volmer equation describes only an idealized active controlled electrode. That is, the electrode kinetics limits the current flow; it is not applicable to situations where electrochemical kinetics are controlled by mass transport of reactant molecules or ions from the bulk electrolyte. More detailed descriptions of traditional electrochemical thermodynamic and kinetic theories and methods may be found in books by Bard and Faulkner [1], Bockris et al. [2], and Mansfeld [4].
Unlike the ideal electrode–solution interface shown in Figure 1.2 and the ideal half-cells shown in Figure 1.3, practical electrode processes such as aqueous metal corrosion involve at least two electrode–solution interfaces and two half-cell reactions occurring simultaneously at the anodic and cathodic half-cells. A typical example is the galvanic corrosion cell shown in Figure 1.1a, which involves an anodic metal dissolution reaction (Fe → Fe2+ + 2e−) and a cathodic hydrogen evolution reaction (2H+ + 2e− → H2) occurring over two separate electrode–solution interfaces. Other examples of galvanic cells include cells made up of electrodes of two dissimilar metals that are connected electrically, and cells containing electrodes of the same electrode material exposed to different oxygen concentrations [3].
In most practical cases, aqueous corrosion reactions occur over a single piece of metal surface rather than over two separate electrodes in a galvanic cell. Such a corroding metal surface is often referred to as a mixed electrode [8] since several different redox reactions with different kinetics and reduction potentials occur simultaneously over the same electrode surface. A microelectrochemical cell model is proposed to explain the uniform corrosion phenomenon, based on the following assumptions:
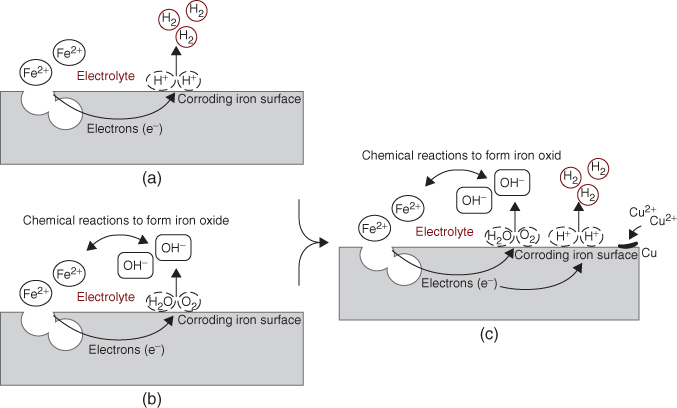
Figure 1.5 shows magnified representations of typical corroding iron surfaces exposed to three different environmental conditions. Figure 1.5a shows a typical iron electrochemical corrosion cell in acidic media where hydrogen evolution is the predominate cathodic reaction. Figure 1.5b shows a magnified corrosion cell under neutral pH or alkaline conditions where oxygen reduction (O2 + 2H2O + 4e− → 4OH−) is the predominate cathodic reaction. Figure 1.5c shows a more complex corrosion system, where more than one reduction reaction occurs simultaneously over an electrode surface. In these microscopic corrosion cells the major corrosion anodic reaction is determined by which species is most easily oxidized, while the major cathodic reaction is the one with the highest reduction potential (i.e., the one with the greater tendency to undergo reduction). In the corrosion system shown in Figure 1.5a, the oxidation of iron has the lowest reduction potential and is therefore forced to undergo oxidation, Fe → Fe2+ + 2e−(E0 = − 0.44 V vs. SHE, iron corrosion), and the reduction of hydrogen is the major cathodic reaction because it is the most easily reduced species in an oxygen-free environment, 2H+ + 2e− → H2(E0 = 0, hydrogen evolution). If other oxidizing agents, such as oxygen and cupric ion (Cu2+), exist in the corrosion environment, as shown in Figure 1.5c, there will be competing cathodic reactions, O2 + 4H+ + 4e− → 2H2O (E0 = + 1.23, oxygen reduction) and Cu2+ + 2e− → Cu(E0 = + 0.34, copper plating).
Figure 1.5 Magnified representation of electrochemical corrosion cells over iron electrodes exposed to various environmental conditions.
More complex mixed electrode–solution interfacial models are often needed to describe practical industrial corrosion processes. Figure 1.6 illustrates a mixed electrode–solution interfacial model illustrating corrosion of iron in a CO2-containing aqueous solution under ambient temperature and atmospheric pressure conditions. Corrosion of iron in a CO2-containing aqueous environment is a typical electrochemical corrosion case that commonly occurs in oil and gas pipelines. CO2 is a naturally occurring component in many oil and gas fields, where CO2 is associated with water, oil, and gas production. In aqueous environments, CO2 dissolves and forms carbonic acid, leading to various forms of steel pipeline corrosion. It is known that CO2 is significantly more corrosive than normal weak acid and that at a given pH, more corrosion of steel is caused by aqueous CO2 solution than by hydrochloric acid [9]. This experimental fact suggests that hydrogen ion is unlikely to be the major corrosive species in CO2 corrosion (i.e., the reduction of H+ is unlikely to be the main cathodic reduction reaction in CO2 corrosion). De Waard and Milliams concluded that the cathodic hydrogen evolution in CO2 corrosion proceeds in a “catalytic” manner by direct reduction of undissociated adsorbed carbonic acid [10]. This mechanism is now generally accepted as the explanation for the strong corrosivity of carbonic acid. The detailed process of the cathodic reduction reaction of CO2 corrosion was reported by Schmitt [11], and the cathodic reaction mechanism proposed is shown in Figure 1.6.
Figure 1.6 Electrode–solution interfacial model illustrating electrochemical and chemical reactions leading to uniform iron corrosion in CO2-containing aqueous solution.

As shown, in CO2 corrosion processes, anode and cathode locations change from period 1 to period 2. A given area on a metal surface would act as both an anode and a cathode over any extended period of time, and the averaging effect of these shifting local reactions results in a rather uniform dissolution of metal surfaces; therefore, this corrosion model would lead to uniform corrosion.
If a more careful investigation of the electrode–solution interface is carried out, it can be found that the uniform CO2 corrosion of iron also involves transport processes occurring simultaneously over an electrode–solution interface. Since electrochemical and chemical reactions would cause the concentration of certain species in the solution (e.g., Fe2+) to increase whereas others will be depleted (e.g., H+), the established concentration gradients will lead to the movement of reactants and products toward and away from the electrode surface. If the transportation of reaction species due to diffusion and convection processes is unable to sustain the speed of the electrochemical reactions, the concentration of species at the electrode–solution interface can become very different from those in the bulk solution [12]. In this case, the electrode–solution model needs to accommodate a two-way coupling between the electrochemical corrosion processes at the metal surface and the diffusion and electromigration processes in the adjacent solution layer. Many corrosion models described in the literature have been developed to illustrate various forms of uniform or general corrosion in more complex environmental conditions.
Wagner–Truad proposed mixed potential theory to explain the operation of mixed electrode cells operating at a mixed potential [8]. According to this theory, any electrochemical reaction can be divided algebraically into separate oxidation and reduction reactions with no net accumulation of electrical charge. In the absence of an externally applied potential, the oxidation of a metal and the reduction of species in solution occur simultaneously at a metal–electrolyte interface. Under these circumstances, the net measurable current is zero and the corroding metal is charge neutral, with no net accumulation of charge. For metals, the electrochemical potential of a metal at the anodic site is assumed equal to that at the cathodic site, due to its very low resistance [8].
Corrosion is a typical mixed electrode process operating at a mixed potential: the corrosion potential. The corrosion potential can be measured using an experimental setup similar to that shown in Figure 1.3, by recording the potential difference between a corroding electrode where both anodic and cathodic reactions occur, and a stable reference electrode. The corrosion potential is commonly used in conjunction with an E–pH diagram (often referred to as a Pourbaix diagram) as an indicator of the corrosion thermodynamic status to predict if corrosion will occur, to estimate the composition of corrosion products, and to predict environmental changes that would prevent or reduce corrosion attack. The E–pH diagram is a graphical representation of the thermodynamics of common electrochemical and chemical equilibria between metal and water, indicating thermodynamically stable phases as a function of electrode potential and pH [13]. An E–pH diagram can be constructed through application of the Nernst equation to each of these electrode reactions as a function of pH. Many E–pH diagrams have already been constructed for common material-environment systems by corrosion scientists, including those in Pourbaix's laboratory [14]. In many cases, an E–pH diagram can be found from the literature for a particular material environment, although we may need to construct E–pH diagrams for less common systems. Figure 1.7 shows a typical version of the E–pH diagram for an iron–water system at ambient temperature.
Figure 1.7 Simplified E–pH diagram for an iron–water system.

An E–pH diagram visualizes the thermodynamics of corrosion processes and gives information about a metal surface, whether it is in a region of immunity where the tendency for corrosion is nil, in a region where the tendency for corrosion is high, or in a region where the tendency for corrosion may still exist but where there is also a tendency and possibility for a protective or passive film to exist. However, the thermodynamically derived Pourbaix diagram only provides information on corrosion tendency. Like any thermodynamic quantity, the mixed potential value on its own does not provide information on the rate of corrosion. The determination of corrosion rate requires measurement of the kinetics of the corrosion electrochemical process.
The rate of a corrosion reaction (e.g., Fe → Fe2+ + 2e−), could be determined if we are able to measure the flows of electrons in the metallic phase or ions in the aqueous phase because the corrosion current, icorr, should be the sum of electron flows. However, unfortunately, corrosion electron flows could not be measured easily from corroding surfaces because we are unable to measure directly electrons flowing between numerous minianodes and minicathodes located on the same electrode surface. We need to find an indirect way to determine icorr from a corroding electrode surface.
A method of analyzing the kinetics of a mixed electrode under dynamic corrosion is a graphical representation of the kinetics of a mixed electrode (often referred to as an Evans diagram) [5, 14]. Figure 1.8 shows an Evans diagram for iron electrode corrosion in acid. A mixed potential, the corrosion potential Ecorr, is achieved through shifting the potentials of both anodic and cathodic reactions by a corrosion current, icorr. This diagram illustrates a nonequilibrium system where dynamic reactions produce and maintain a corrosion current.
Figure 1.8 Evans diagram for a mixed electrode state of iron corrosion in acid.

An Evans diagram is a very useful tool for analyzing corrosion kinetics and for predicting factors that may affect corrosion reactions; however, it should be noted that an Evans diagram is an imaginative and simplified illustration of electrode “internal” polarization over a corroding metal surface. This diagram is not directly measurable experimentally, and thus it is unable to reveal icorr from a corroding electrode surface.
Pioneers in this field performed numerous experimental and theoretical analyses to find the “missing link” between measurable data from a corroding electrode and icorr values. One idea of how to determine icorr experimentally is to apply a perturbation signal to the electrode using a polarization experimental setup similar to that shown in Figure 1.4 [14]. In polarization measurements, a potentiostat is used to polarize an electrode from its steady-state mixed potential Ecorr (note: not Eeq) to a new electrode potential, E. The overpotential, η = E − Ecorr, is a response to the current applied, which can be adjusted to any value desired. The measured potential vs. current (or log i) data are usually presented as polarization curves. Figure 1.9 illustrates experimental polarization curves that are measurable from iron corrosion in acid, together with a comparison of an experimental polarization diagram to an Evans diagram.
Figure 1.9 Experimental polarization curves and an Evans diagram for iron corrosion in deaerated acidic solution.
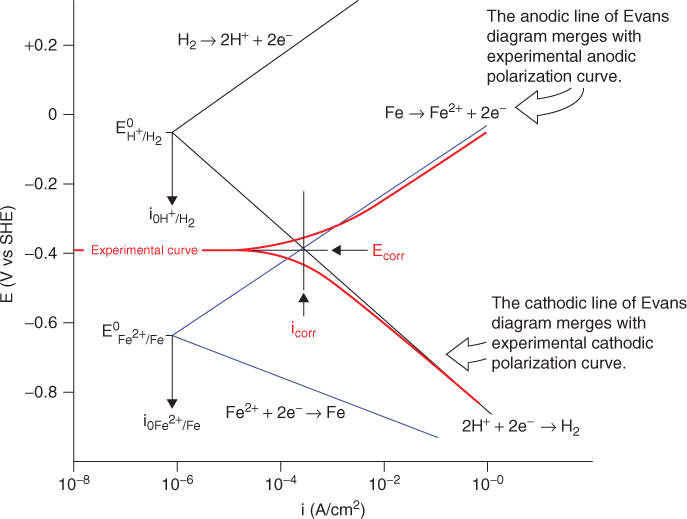
The Evans diagram and the polarization curve can both be used to describe mixed electrode processes leading to metal corrosion. They are different but related. The Evans diagrams in Figure 1.9 are simplified plots of anodic and cathodic reaction curves of an electrochemical system, while the polarization curves describe the potential current density behavior obtained experimentally by applying an external potential or current. It is clear that the anodic and cathodic polarization curves merge with the Evans diagram under an area of relatively high polarization (usually referred to as the Tafel region). This suggests that the corrosion potential Ecorr and corrosion current icorr could be determined by extrapolation of the polarization curve. This method, often referred to as the Tafel method, was discovered experimentally by a pioneer in this field [3, 14].
The fundamental formula describing the kinetics of an electrochemical reaction, the Butler–Volmer formulation [equation (1.3)], can be applied in conjunction with mixed-potential theory to determine corrosion kinetics over a uniform electrode surface. If anodic and cathodic reactions over an electrode surface are activation controlled and the corrosion potential is far away from the equilibrium potentials of the individual anodic and cathodic reactions, the Butler–Volmer equation can be applied to a mixed electrode system:
1.4 
where η is the overpotential (η = E − Ecorr), i the measured current density, icorr the corrosion current density, F is Faraday's constant, R the universal gas constant, T the absolute temperature, n and n′ the number of electrons transferred in the anodic and cathodic reactions, and α and β are coefficients related to the potential drop through the electrochemical double layer.
Equation (1.4) is a fundamental formula for measuring corrosion reaction kinetics. In its practical application, this equation is often simplified. The two most commonly used simplified forms of the equation are the Tafel equation and the Stern–Geary equation. The Tafel equation can be deduced from equation (1.4) for sufficiently high values of the applied potential. For anodic polarization, when η  RT/βn′F, equation (1.4) can be simplified as
1.5 
that is,
1.6 
or, for cathodic polarization, when − η > > RT/αnF, equation (1.4) can be simplified as
1.7 
that is,
1.8 
Equations (1.6) and (1.8) have the form of the Tafel equation:
1.9 
where a and b are Tafel constants: a = − (2.3RT/αF)logicorr and b = (2.3RT/αF) for anodic polarization, or a = − (2.3RT/βF)logicorr and b = (2.3RT/βF) for cathodic polarization.
Equation (1.9) provides a theoretical background to the Tafel method (also referred to as the Tafel line extrapolation method) that was discovered experimentally [3, 14]. According to the Tafel equation (1.9), the value of either the anodic or the cathodic current at the intersection is icorr. This suggests that corrosion current icorr can be determined by extrapolating the linear portions of the Tafel plot back to their intersection, where the overpotential (η = E − Ecorr) is zero. Figure 1.10 illustrates determination of the corrosion current, icorr, using the Tafel line extrapolation method. The Tafel extrapolation method is often used to determine corrosion parameters, including corrosion current and Tafel slopes; however, the Tafel equation is true only for relatively high overpotentials, 100 mV or higher, and thus use of this method requires application of a large polarization voltage, which could cause irreversible damage to the electrode surface. The Tafel method is therefore not recommended for continuous corrosion rate measurement and thus is of only limited value for corrosion rate monitoring.
Figure 1.10 Tafel line extrapolation for determining electrochemical corrosion parameters.

Stern and Geary simplified the Butler–Volmer formula for low polarization ( ≤ 10 mV) and developed an equation that can be used to determine the corrosion rate without significantly damaging the electrode surface [15]:
1.10 
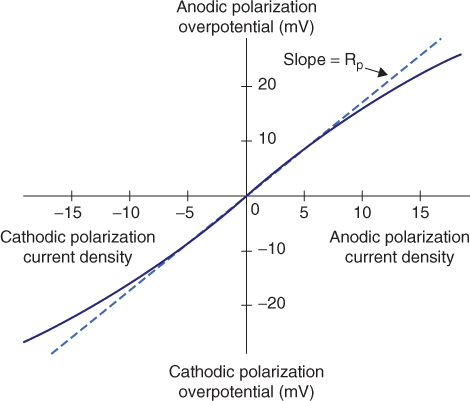
where icorr is the corrosion current density, ba and bc are anodic and cathodic Tafel slopes, and Rp is the polarization resistance, which is defined as the tangent of a polarization curve at the corrosion potential:
1.11 
The Stern–Geary equation (1.10) provides a new method, usually referred as the linear polarization resistance (LPR) method, for corrosion current icorr determination [16]. When measuring the corrosion rate using this method, only a small polarization voltage (normally, x ± 10 mV) is applied to a freely corroding electrode, and the resulting “linear” current response is measured. The polarization resistance is the ratio of the applied perturbation potential and the resulting current response in equation (1.11). According to the Stern–Geary equation (1.10), this “resistance” is inversely related to the uniform corrosion current density icorr. Figure 1.11 illustrates the LPR method for determining Rp. The ba and bc values are normally determined by a Tafel curve or weight-loss measurements. They can also be estimated by linear polarization measurement by carrying out a nonlinear least-squares fit of the dc linear polarization data to the Stern–Geary equation [16, 17].
Figure 1.11 LPR method for determining Rp.
Compared to techniques using very large anodic or cathodic overpotentials, such as the Tafel method, the Stern–Geary method has advantages because it is essentially a nondestructive technique. It has become probably the most popular electrochemical method for determining the corrosion current, icorr, which can be converted to a more convenient corrosion weight-loss value:
1.12 
where icorr(t) is the corrosion current density at time t (in A/cm2), s the electrode surface area (in cm2), T the experimental duration (in seconds), and Ew the equivalent weight of electrode material (27.92 for iron).
In practice, electrochemical measurements are carried out regularly with interval δt. For simplicity, the corrosion rate during the interval of each measurement could be taken as a constant. So equation (1.12) can be rewritten as
1.13 
where δt(n) is the test interval (in seconds) during which the corrosion rate is icorr(n).n is the series number of tests and k is the total number of tests during the entire experiment. Combining equations (1.10) and (1.13), for a mild steel electrode the corrosion weight loss can be calculated from Rp by
1.14 
However, it should be noted that under some circumstances the LPR method has been found to be unreliable, and large errors can occur in LPR corrosion rate measurements [18–20]. One of the reasons for these errors is that the experimental Rp value contains contributions from ohmic resistances, such as the solution resistance between the Luggin capillary and the test electrode, surface scale resistance and inhibitor film resistance, and so on. Although methods such as the positive feedback technique and the interrupter technique have been developed and employed to remove the effects of ohmic resistances, a detailed study of these techniques has shown that they have limitations and are very difficult to apply [19]. For these reasons, the LPR technique is generally not applicable to systems where there is large solution resistance, surface scale resistance, or inhibitor film resistance.
EIS has been developed as an alternative technique for polarization resistance measurement [21]. EIS is considered to be a more reliable technique because it is supposed to be able to separate different corrosion electrochemical processes and thus be able to eliminate measurement errors due to solution resistance and surface film resistance. EIS is also employed in the investigation of corrosion coating and inhibition through obtaining information about electrode–inhibitor film interfacial characteristics and integrity [4, 22]. Corrosion measurement using EIS has already been discussed by many authors, in particular Mansfeld [4].
Electrochemical noise analysis (ENA) is another method that has been used to determine polarization resistance by measuring the electrochemical noise resistance [23]. Noise resistance is the ratio of the standard deviation of voltage noise and the standard deviation of current noise. It has been found to be similar (or equivalent) to the charge transfer resistance or polarization resistance and thus can be used to calculate corrosion rates [20]. Noise resistance measurements use only simple instruments and do not apply perturbation to the test system by an externally imposed polarization, which would lead to inevitable changes in such system-specific properties as the surface structure and roughness, and the sorption processes of inhibitors. More detailed descriptions of the theory, measurement, and analysis of the noise resistance technique may be found in a book [24] and several articles [25–28].
To understand the advantages and disadvantages of major corrosion measurement techniques, including weight-loss measurement, LPR, ENA, and EIS, these techniques have been applied simultaneously to measure uniform CO2 corrosion with and without the influence of surface scales and inhibitor films [20, 28]. In simple low-resistance corrosion environments such as a bare electrode–coupon in an electrochemical cell containing 640 mL of 3% NaCl brine with CO2 sparging at 50°C all techniques yielded similar corrosion rates (Figure 1.12), [20]. This result suggests that all these techniques can be used to measure corrosion rates in low-solution-resistance systems.
Figure 1.12 Comparison of weight loss measured using weight-loss coupons, EIS, and LP of a bare electrode and coupons in 640 mL of 3% NaCl brine with CO2 sparging at 50°C. (From [20].)

When a bare electrode was put in 3% NaCl brine in the presence of 50 ppm of the inhibitor imidazoline with CO2 sparging at 30°C polarization resistance values from LPR, EIS, and ENA measurements generally correlate well (Figure 1.13). This result suggests that these techniques can be used effectively to measure corrosion rates on electrode surfaces with inhibitor adsorption [20]. However, with the formation of a high-resistance inhibitor film on an electrode surface, the LPR technique was found to lose accuracy. In an experiment, a thick commercial batch treatment inhibitor was formed on steel electrode–coupon surfaces, and major differences between the weight-loss and electrochemical methods were observed [20]. Weight-loss and electrochemical measurement results have a difference of more than 500-fold. It is suggested that the reliability of LPR should be checked by EIS and weight-loss measurements if the corrosion environment has a high solution resistance or if a dielectrical surface film is present [20].
Figure 1.13 Comparison of Rp (LPR), R (EIS), and Rn (ENA) measured during inhibitor film formation. (From [20].)

Each electrochemical technique has advantages and limitations; therefore, different techniques are often applied in a synergistic manner. For example, corrosion potential measurements are used to investigate the effects of corrosion inhibitors on corrosion thermodynamics, while LPR, EIS, and ENA are used to monitor changes in electrode processes kinetics. Care should be taken, however; these techniques are accurate only under several fundamental assumptions [19], and in principle these techniques are applicable only to uniform corrosion systems.
–