

Introduction
Chapter 1. Description of Granular Materials, Definitions
1.1. Introduction
1.2. Density
1.3. Porosity of granular material
1.4. Compactness
1.5. Void ratio
1.6. Relative compactness
1.7. Saturation point
1.8. Moisture content
1.9. Ratio between the different densities
1.10. Absorption of water
1.11. Bibliography
1.12. Exercises
Chapter 2. Granulometry
2.1. Introduction
2.2. Characterization of the shape of grains
2.3. Methods of granulometric analysis
2.4. Granularity: presentation of results
2.5. Granularity of a mixture of aggregate
2.6. Bibliography
2.7. Exercises
Chapter 3. Specific Surface Area of Materials
3.1. Definition
3.2. Calculating the specific surface area of a granular material
3.3. Methods based on permeability and porosity measurements
3.4. Methods based on the adsorption of a gas
3.5. Methylene blue test for the characterization of fine particles
3.6. Bibliography
3.7. Exercises
Chapter 4. Voids in Granular Materials and the Arrangement of Grains
4.1. Introduction
4.2. Sphere packing (one-dimensional: Φ = 2R): theoretical approach and experimental data
4.3. Experimental data
4.4. Influence of grain shape
4.5. Search for maximum compactness
4.6. Bibliography
4.7. Exercises
Chapter 5. Voids in Concrete
5.1. Definitions
5.2. Characterization of heterogeneous materials
5.3. Specific surface area of porous solids
5.4. Measurements of the porosity of consolidated materials
5.5. Porometry
5.6. Bibliography
5.7. Exercises
Chapter 6. The Fundamentals of Diffusion
6.1. The basics of diffusion
6.2. Diffusion in porous media
6.3. Measurement of the effective diffusion coefficient in porous matter
6.4. The relationship between the effective diffusion coefficient and porous structure
6.5. Gaseous diffusion
6.6. Bibliography
6.7. Exercises
Chapter 7. Permeability
7.1. Introduction
7.2. Definition of the permeability of a material
7.3. Measurement of permeability
7.4. The relationship between permeability and porous structure
7.5. The drying of concrete
7.6. Physical parameters and performance-based approach
7.7. Bibliography
7.8. Exercises
Index

First published 2012 in Great Britain and the United States by ISTE Ltd and John Wiley & Sons, Inc.
Apart from any fair dealing for the purposes of research or private study, or criticism or review, as permitted under the Copyright, Designs and Patents Act 1988, this publication may only be reproduced, stored or transmitted, in any form or by any means, with the prior permission in writing of the publishers, or in the case of reprographic reproduction in accordance with the terms and licenses issued by the CLA. Enquiries concerning reproduction outside these terms should be sent to the publishers at the undermentioned address:
| ISTE Ltd 27-37 St George’s Road London SW19 4EU UK |
John Wiley & Sons, Inc. 111 River Street Hoboken, NJ 07030 USA |
| www.iste.co.uk | www.wiley.com |
© ISTE Ltd 2012
The rights of Jean-Pierre Ollivier, Jean-Michel Torrenti, Myriam Carcassès to be identified as the author of this work have been asserted by them in accordance with the Copyright, Designs and Patents Act 1988.
Library of Congress Cataloging-in-Publication Data
Ollivier, Jean-Pierre, 1946 Apr. 19-
Physical properties of concrete / Jean Pierre Ollivier, Jean Michel Torrenti, Myriam Carcasses.
p. cm.
Includes bibliographical references and index.
ISBN 978-1-84821-330-2
1. Concrete. 2. Concrete--Analysis. I. Torrenti, Jean Michel. II. Carcassés, Myriam III. Title.
TP882.3.O45 2012
666′.893--dc23
2012003201
British Library Cataloguing-in-Publication Data
A CIP record for this book is available from the British Library
ISBN: 978-1-84821-330-2
Concrete is manufactured at the plant or on site from various components: cement, water and different granular materials such as sand, gravel and various mineral additions. It may also contain admixtures intended to modify its properties from its fresh state (for example retarding or accelerating admixtures, superplasticizer) or its properties in its hardened state (for example air entraining agents). Properties introduced in this material are varied. They concern both its fresh state through its ability to be transported and poured in forms that are more or less fluid, as well as in its hardened state. Properties include its performances, for example mechanical resistance, resistance to aggressive environments, and acoustic or heat insulation. The formulation of concrete consists of finding components and their proportions to meet specific requirements, which may be very different. All of this should be done keeping in mind that concrete is a widely used material, its cost should be limited, and it is prepared and implemented on site in variable environmental conditions.
Understanding the rheological properties of fresh concrete, the hydration phenomenon of cement responsible for structuration, the relationship between the characteristics of the porous solid obtained and its mechanical performances or resistance to the aggressive penetration requires a complex knowledge of the physicochemistry of reactive porous materials. The development of simple formulation rules therefore requires the assimilation of this knowledge and a good command of the properties of these materials.
The purpose of this book is to provide the “mix designer” with useful knowledge on granular and porous materials, which will enable the innovative design of concrete. Topics covered include the characterization of granular materials, the concepts of porosity and specific surface area, and the transport properties (diffusion and permeation) of concrete. Some of these topics are already covered in other general books dedicated to granular or porous materials. The objective here is to bring them together in one book by adapting them for use by concrete specialists.
Simulations in the form of exercises are offered at the end of each chapter to enable readers to assimilate theoretical knowledge and to apply such knowledge to specific problems encountered in civil engineering.
We call a set of grains “aggregate”. We also refer to this as granular material. Several civil engineering materials are granular materials: soil, road-building materials or concrete before the setting the binder, etc.
Let us consider a grain, as shown in Figure 1.1. This grain consists of a solid phase, voids or open pores and voids or closed pores. The former communicates with the outside, and the latter are included in the solid phase.
Figure 1.1. Definition of a grain
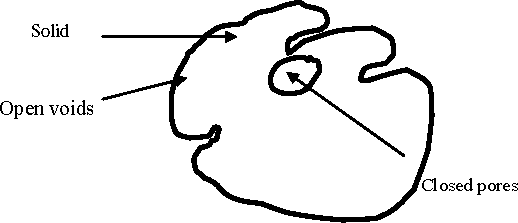
By definition, the grain volume is the sum of the volume of a grain in its solid phase and the volume of the closed pores.
Let us now consider a set of grains. vg is the grain volume of this set.
Different volumes are defined:
– Va is the apparent volume of granular material. This is, for example, the volume of the container that holds all of the material or the volume of the stack of material if it is in bulk (which is the bulk volume).
– vs is the volume of the total solid phase.
– v is the void volume: the total volume of the intergranular voids and open voids of grains. The geometric definition of the open void volume of a grain is not simple, as it necessitates the prior definition of the envelope of the grain. In practice, we speak of the void volume accessible to water. In the case of a granular material, the definition of void volume is simpler: it is the difference between the apparent volume and the grain volume.
Va=vg+v
The void volume is wholly or partially full of air or water.
We distinguish:
– The solid density:  where ms is the solid mass. This mass is ordinarily measured after drying, where the water contained in the open pores evaporates. We also refer to it as dry mass.
– The density of grains:  . This density is less than or equal to ρs according to the presence or absence of closed pores in the grains.
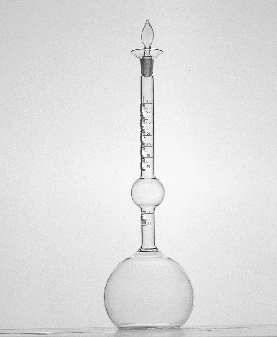
For example, in the case of cements these two densities are identical. Their measurement is taken using a volumeter (or hydrometer), known as the Chatelier, in accordance with standard EN 196–6.
Figure 1.2. The Chatelier volumeter or hydrometer (CONTROLAB)
To characterize cement, it is placed in a glass container raised in a graduated cylinder (the volumeter), which contains oil (cement being reactive with water, it is advisable to choose an inert liquid). The change in volume is measured by the displacement of the oil in the graduated cylinder and the mass of the cement is obtained by weighing the volumeter twice: before and after adding the cement.
In the case of concrete aggregates, the NF EN 1097–6 standard defines four densities1. The latter definitions complicate the landscape slightly, but they are subject to requirements. They are subject to standard methods of measurement (NF EN 1097–6), which can be found in the exercises presented at the end of this chapter.
The density of granular material, also known as the bulk density, ρ, is defined as the apparent mass per unit volume of aggregate:

where ms is the mass of grains (it is also the mass of solid) and me is the mass of water contained in the voids.
When the material is dry (me = 0), the density is called the “dry density” and is written as ρd.
The density of a granular material depends on:
– the density of grains,
– the arrangement of the grains in space; and
– the quantity of water present in the voids.
Before being more specific about it (see section 1.8), we must define the variables characterizing the arrangement of the grains and the presence of water in the voids.
This is the ratio between the void volume and the apparent volume:

This is the ratio between the volume of grains and the apparent volume:

This is the ratio between the void volume and the volume of grains:

Porosity, compactness and the void ratio are the three quantities that characterize the relative volume fractions of voids and grains of a granular material. Relationships exist between them and knowledge of one enables us to calculate the other two. For example, the measurement of the porosity of an aggregate is taken by weighing the quantity of the dry material, ms, filling a container of a known volume, Va. Knowing the density of the grains, ρg, the porosity is calculated using the formula:

These three quantities depend on the shape and size of the grains of the granular material. To manufacture concrete, different granular materials are mixed in order to achieve a compact granular skeleton. This important objective is discussed in detail in Chapter 3. Let us compare the orders of magnitude of the porosities of granular materials:
– Sand: 21–50% (for example 35% of great Erg sand, 31% of Albien sand from the Parisian basin (l' Albien du Bassin Parisien), 24% of sand from the Barremian of the Parisian Basin (Barrémien du Bassin Parisien).
– Gravel: 25–40%.
– Clay: 44–50%.
– Cement: approximately 66%.
– Silica fume in grains: approximately 95%.
Porosity also depends on how the grains of the material arrange themselves in space. Under the effect of compression or vibration, porosity can be reduced (see section 1.6). It is therefore not a variable intrinsic to the material because it depends on the conditions of its “implementation”. In the case of cement and of silica fume, it is noted that the porosities are very high: if silica fume was being transported in grain form, 95% of the volume of the load would consist of voids! These very high values will be discussed in Chapter 2. They arise from strong electrostatic repulsions due to the superficial electric charges of the grains, which repel each other.
The void ratio of a given aggregate may vary in accordance with the way the grains are arranged in space against one another. For example, if sand is poured very slowly into a container that is leveled, we obtain a loose arrangement corresponding to the maximum void ratio, emax. If the container is shaken, the apparent volume of the material is reduced, as is the void ratio. Gradually, as the vibration energy increases, the void ratio approaches a lower limit, emin.
The compactness or the relative compactness index enables a void ratio e to be collected that is in the range of possible values:

The relative compactness of a given aggregate, sometimes called the “compactness index”, only depends upon its implementation.
We can distinguish conventionally between two categories of materials:
– coherent materials (e.g. clays) whose minimum void ratio depends on the applied stress (or even the speed of application of the stress); and
– non-coherent materials whose minimum void ratio does not depend on the applied stress. Granular materials used in the manufacture of concrete fall into this second category and in this book we limit ourselves to just such materials.
The voids of granular materials may contain water. Two quantities — one density (saturation point) and the other weight (moisture content) — are defined to characterize the quantity of water present in an aggregate.
This is the ratio between the volume of water, ve, contained in the voids and the void volume:

The saturation point varies between 0 (dry material) and 1 (saturated material).
This is the ratio between the mass of water, me, and the mass of dry material (or mass of grains):

The moisture content is equal to 0 in the case of a dry material and in some instances may be greater than 1 (particularly in the case of some clays).
Measurement of the moisture content of aggregates used in the manufacture of concrete is essential, because if the methods of formulation enable determination of the efficient dosage of water (standard NF EN 206–1) of concrete (typically expressed as L/m3 or as kg/m3), it should take into account the water contained within the aggregates to determine the quantity of water that needs to be added. The measurements must be simple, as they must be routinely applied upon receipt of the aggregates.
The reference method is the gravimetric method. There are also a chemical method, electrical methods and a method based on the absorption of neutrons. These methods are outlined briefly in the following sections.
The mass of water contained in the aggregate is determined by the difference in the wet mass of a sample of aggregate and its dry mass obtained after drying at 105°C ±5°C to constant mass (two successive weighings, separated by at least one hour, should not differ by more than 0.1%). Generally the aggregate must be dried for approximately 24 hours [CAL 04]. To speed up the drying, an alternative source of heat can be used such as infrared lamps or halogen lamps. The aggregate can even be dried in the microwave.
Figure 1.3. The frying pan method, also known as the frying stove method (CONTROLAB)
The moisture content of aggregates can also be measured with the method known as “the frying pan”, according to the standards NF P94-049-2 and NF P18-554.
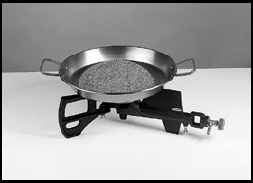
Figure 1.4. Calcium carbide moisture meter (CONTROLAB)
A chemical method can be implemented using a “Speedy” or “Super Speedy” moisture meter (26 g or 142 g respectively), depending on the quantity of material tested. The wet aggregate is placed in the presence of excess calcium, which reacts with water according to the reaction:

The amount of acetylene, C2H2, produced is proportional with the mass of water contained in the aggregate. The moisture content is read directly from the device, which in fact measures the pressure of the acetylene. Given the small mass of aggregate tested, the use of this device is only recommended for fine materials (sand), see Chapter 2 for the definition.

These methods are based on the influence of the liquid water contained in a granular material on its resistivity (or conductivity). Thus, for a moisture content ranging from 5 to 25%, the resistivity of sand is divided by a factor of 10. The measurements are taken with probes immersed in the granular material. The measurements are also sensitive to temperature, the presence of dissolved salts and the shapes and sizes of the grains.
Water also has a strong influence on the permittivity of a granular material. The relative permittivity (the ratio between the absolute permeability of a medium and of air) is thus in the range of 5 for a solid grain and approximately 80 for water. The permittivity of a wet aggregate therefore depends on the water it contains and this property is used for measuring the moisture content [PAQ 71].
If a probe is immersed in fast neutrons (several km/s) of high energy (several MeV) in a granular material, the neutrons undergo elastic collisions (without energy loss) when they meet the heavy atoms of the grains. In a collision with a light atom, such as hydrogen whose mass is practically that of a neutron, the loss of energy is significant. After a number of collisions with hydrogen atoms, the neutron possesses energy in relation to its mass and the temperature of the medium: it reaches the thermal or slow state.
Measurement of the concentration of slow neutrons, after calibration, enables the assessment of hydrogen concentration, and therefore the moisture content of the wet aggregates. The fast neutron source (radiumberyllium or polonium-beryllium) and the slow neutron sensor are placed in the same probe because the result depends on the distance between the transmitter and receiver.
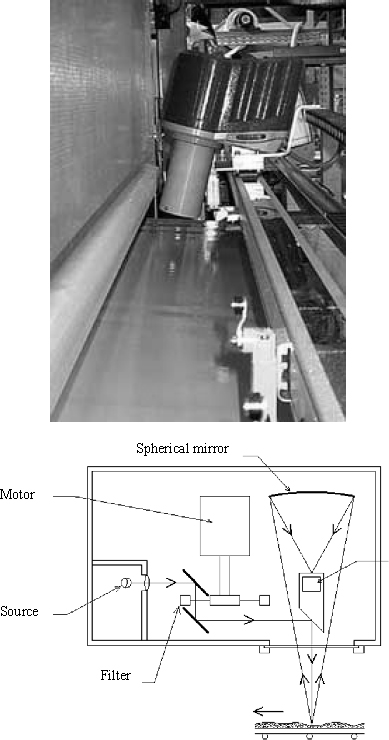
Infrared radiation wavelengths centered at the absorption peak of water are emitted towards the granular material. The reduction in radiation measured is based on the humidity and the moisture content. This is inferred from the specific calibration of the material as the wavelength of the infrared beam depends on the optical properties of grains.
Figure 1.5. Infrared moisture meter — flow chart [CAL 04]
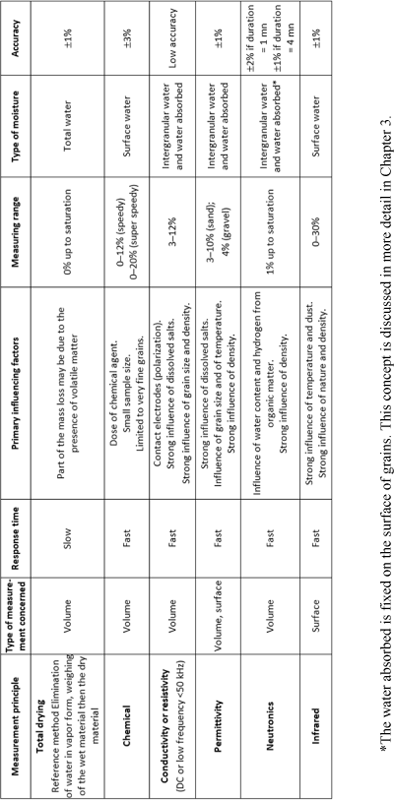
Methods of measuring the moisture content of aggregates are numerous and are based on very different principles. In [CAL 04], their implementation and their scope are described in detail. Table 1.1, taken from the same reference, gives the selection criteria for the methods listed above.
Table 1.1. Selection criteria for different methods of measurement
The density of a granular material depends on the grain density, porosity and saturation state.
It can be expressed in the following way:

When the material is saturated, the density of the granular material (ρe = density of water) is:

In the general case, for any saturation point, s, we can write:

Another ratio can express the density of an aggregate based on its moisture content:

The grains of a granular material have the capacity to absorb water by capillary action (see Chapter 5). This capability is characterized by a variable known as “water absorption” and is defined as the ratio between the dry mass and the increase in the mass of the sample of aggregates due to water penetration in the accessible pores.
Its measurement is subject to standard NF EN 1097-6.
[CAL 04] CALIBÉ, Results and Recommendations of the National Project, Calibé, the Quality Control of Concrete, ENPC Press, Paris, 2004.
[PAQ 71] PAQUET J., “Moisture measurement in situ for dielectric method of application to concrete”, Materials and Structures, vol. 4, no. 2, pp. 67–124, March 1971.
Exercise 1.1: calculation of the density of grains in a mixture
As is the case for concrete in civil engineering. aggregates are frequently combined to obtain mixtures of maximum compactness (see Chapter 2). This exercise aims to determine the density of grains in a mixture of two aggregates, with knowledge of the densities of the grains in the two aggregates and the proportions by volume or mass of the two aggregates in the mixture.
Two aggregates, 1 and 2, are mixed. The data are summarized in Table 1.2.
Table 1.2. Parameters of Exercise 1.1

Show the relationship between the density of grains in the mixture ρ according to the densities of grains ρ1 and ρ2 and weight proportions x1 and x2.

Show the relationship between the density of grains in the mixture ρ according to the densities of grains ρ1 and ρ2 and volume proportions y1 and y2.
ρg=y1 ρg1+y2ρg2
NOTE 1.1.– Note that due attention should be paid to this calculation on how we define the proportions of the mixture.
NOTE 1.2.– In Chapter 2, we will show that such a calculation cannot be carried out to determine the bulk density of a mixture of two aggregates.
Exercise 1.2: density measurement and pycnometer method
The pycnometer consists of a glass funnel (1) equipped with a marker (2) on the vertical rod. This funnel is connected to a bottle (4) by means of an oiled part (3), see Figure 1.6.
Figure 1.6 Pycnometer according to standard NF P18-555 (CONTROLAB)
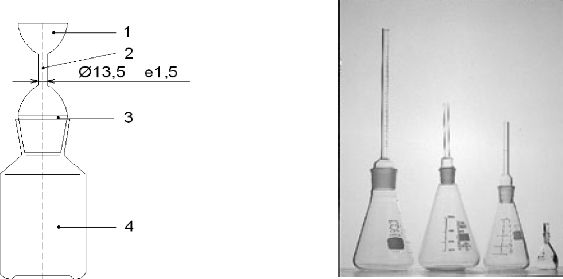
The size of the pycnometer is adapted to the size of the grains to be characterized. A sample of the aggregate to be characterized is taken and placed in the flask of the pycnometer. The flask is filled with water and, after closing the funnel, the water level is adjusted to the level of the mark. After 24 hours of immersion, the pycnometer is weighed, with M1 being the mass.
The pycnometer is drained while taking care to preserve the aggregate. It is then filled with water up to the mark, with M2 being its mass.
The aggregate is spread out to form an even layer and is exposed to a weak stream of hot air to evaporate the surface moisture in order to reach the “saturated-surface dry” state, which is free of any trace of surface moisture and where the grains are not bonding to one another. M3 is the mass of the dry grains of the saturated surface.
Finally the aggregate is dried in an oven at 110°C to constant mass, with M4 being the dry mass.
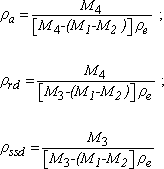
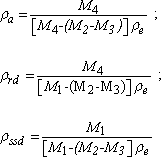
Express:
– the absolute density, ρa;
– the real density determined by drying in an oven, ρrd;
– the actual saturated surface dry density ρssd according to masses M1, M2, M3 and M4; and
– the density of water, ρε.
Knowing that the accuracy of the scale used is 0.01g and that the temperature of the trial is near to 20°C, but that it can vary by up to 4°C either side of this, calculate the accuracy of the measurement ρa.
Additional data: the variation of the density of water, ρε, with temperature is given in Table1.3.
Table 1.3. Variation in the density of water according to temperature

NOTE 1.3. – this method enables us to calculate the coefficient of water absorption:

Correcting factor:
Exercise 1.3: measurement of the density of grains by hydrostatic weighing
Figure 1.7. Built for hydrostatic weighing (CONTROLAB)
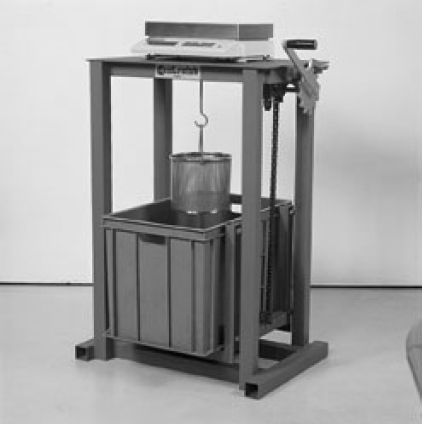
The grains to be characterized are deposited in a basket made of fine mesh wire (that holds the grains), see Figure 1.7. The basket is connected to the tray of a scale.
The basket containing a sample of aggregate to be tested is submerged in water. The result of the weighing is M1. The basket is then emptied and weighed in a water vacuum, with M2 being the result of the second weighing. The grains are spread and dried until the water is no longer visible, ensuring that the grain surface always appears wet. The grain mass in this state is M3. The grains are then dried in an oven at 110° C to a constant mass (M4).
Express:
– the absolute density, ρa ;
– the actual density of drying in an oven ρrd,
– the actual saturated surface dry density ρssd according to masses M1, M2, M3 and M4; and
– the density of water, ρ.
NOTE 1.4.– this method enables us to calculate the coefficient of water absorption:

Correcting factor:
Exercise 1.4: preparation of a specimen with fixed characteristics.
We want to prepare a cylindrical specimen of slag-sand2 (with a height of 100 mm and diameter of 100 mm) using static compression. The proportions by weight of the different dry components are as follows:
– sand, S1 = 80%;
– sand, S2 = 10%;
– slag, L = 9%; and
– enzyme A = 1%
The characteristics of the components are summarized in Table 1.4.
| Components | Density of grains (g/cm3) | Moisture (%) |
| Sand S1 | 2.64 | 0.3 |
| Sand S2 | 2.66 | 5.1 |
| Slag | 2.90 | 6.0 |
| Enzyme | 2.56 | 0.0 |
Table 1.4. Density and moisture of the components
The dry density of the material obtained after compression (made in a sealed mold) is ρd = 2.21 × 10³ kg/m3 and the moisture is 6.5%.
1. What are the masses of the four solid and wet components and that of the water to be added to the mold?
2. What is the porosity and what is the saturation point of the specimen?
1 The actual density determined after drying in an oven, ρrd: the ratio between the mass of grains dried in an oven and the volume that they occupy in water, including closed pores and those accessible to water.
The absolute density, ρa: the ratio between the mass of grains dried in an oven and the volume that they occupy in water, including closed pores but excluding those accessible to water. This definition corresponds to the density of the grains.
The actual density of saturated surface dry, ρssd: the ratio between the mass of a sample of grain, including the mass of water present in the pores that are accessible to water, and the volume that they occupy in water, including closed pores and those accessible to water.
The actual pre-dried density, ρp: the dry grain mass per unit volume (the volume is determined as the volume of the particles, including closed pores and those accessible to water).
2 Slag-sand is a material used in the manufacture of road-building materials. It combines sand and a binder, the slag. This slag is a finely ground by-product of the steel industry. It reacts with water and an enzyme (e.g. lime) to make hydrates. The material structures itself and thus passes from the granular to the consolidated state, which enables the road-building materials to bear mechanical loads due to traffic.
Granulometry is used to determine the grain size of a granular material. Results of granulometric analysis (known as granularity) may be represented, for example, in the form of a distribution size curve.
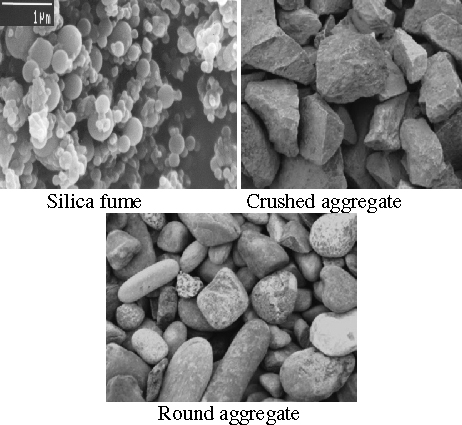
Grains of different granular materials involved in the composition of concrete have very different shapes. Some are spherical, such as silica fumes, some have an angular shape, such as crushed aggregates, and others have a rounded shape, such as the grains of round aggregates from alluvial origins (see Figure 2.1). The shape of grains has a significant influence on the properties of concrete, particularly on the compactness of the granular mixture and the fluidity of concrete in its fresh state.
Given that most grains have a shape of some kind, the geometric definition of the “size” is initially very difficult. In practice, the definition of the “size” of a grain has a conventional character, which depends on the method of measurement implemented. Measurement may be direct, in which case the definition of the “size” is relatively simple. Measurements may also be taken by indirect methods, which provide equivalent sizes in relation to the physical property being measured. According to the method used, the granulometry result may change. It is therefore essential to carefully specify the experimental method used when we present the result of a granulometric analysis.
Figure 2.1. Granular materials consist of grains of different shapes
Generally, the size of a particular grain is of no interest. The information sought concerns how the grain size of a granular material is distributed. To obtain this information, a sample of the material is taken and due attention given to its representativeness. Methods of sampling exist for this: quartering or the use of a lane divider. In standard NF EN 932–1, Tests to Determine General Properties of Aggregates, parts 1 and 2 are devoted to the methods of sampling and methods of reduction of a laboratory sample, respectively.
Section 2.2 of this chapter describes variables. These enable us to characterize the shape of grains. Granulometry methods are discussed later in section 2.3. Sieving is used for particles with sizes larger than 100 μm. For smaller particles, methods based on different physical principles will be described. How to present granulometry results will be the subject of section 2.4.
During the granulometric analysis of a granular material, attention must be given to the dispersion of the particles. Fine particles in dry air tend to repel one another due to the effect of electrostatic forces because their surfaces frequently have charges of the same sign. As soon as moisture in the air accrues, the particles may agglomerate and the measurement of grain size becomes more complicated. In the case of coarse grains this is not usually a problem, although sand and gravel have to be carefully prewashed to eliminate the smallest particles before carrying out granulometric analysis by sieving (see section 2.4). In the case of very small particles (less than 100 μm), the methods of analysis often require pre-dispersion in a liquid and we must ensure that the grains are properly separated from one another (we must deflocculate the grains, see Chapter 3).
In general, the shape of particles is characterized by the geometric quantities and, as in the case of the flattening coefficient for example, they may match the standard methods of measurement (see standard NF EN 933–3).
If a denotes the largest grain, c the smallest grain and b an intermediate size, we can define:
[2.1] 
[2.2] 
[2.3] 
We can define two equivalent spheres: the isovolume sphere, which has the same volume as the grain; and the isosurface sphere, which has the same surface as the grain. If ø1 is the diameter of the isovolume sphere and ø2 the diameter of the isosurface sphere, the sphericity factor ψ is defined by the ratio:
[2.4] 
The sphericity factor is also defined by the ratio between the surface of the isovolume sphere and the surface of the particle. These two definitions are equivalent.
The term  is called the angularity factor. Its value is even larger than the grain in a shape that moves away from being spherical. For example, the angularity factor of the sphere is equal to 1, for a cube it is
  and for a parallelepiped (a × a × 2a) it is
  .
.
Exercise 2.1 gives an application using an aggregate in the shape of an ellipsoid.
To illustrate the difficulty of associating grain size with a shape of some kind, let us consider two geometric definitions of the size of a particle. Figure 2.2a shows a grain on a projection plane. Note before proceeding that this projection depends on the chosen plane. We can define two “diameters” to characterize the size of the grain:
– Feret's diameter D1 is the distance that separates two extreme tangents in the projected area brought parallel to a right angle.
– The projected diameter D2 is the diameter of the circle with the same area, A, as the projection of the grain.
Figure 2.2. Definition of Feret's diameter and the projected diameter

Not only are these two diameters generally different, but Feret's diameter also depends on the direction of the projection line. This figure illustrates the conventional character in the definition of the size of a grain. It shows us how important it is to clarify the definition retained. In general, the definition of the size of the grain is associated with an experimental method. It will serve us to clarify this.
Sieving consists of sorting a granular material by granulometric denominations from different sieves.
The sieves are made of braided metallic wires or perforated sheets and have square side openings, d, see Figure 2.3. Value d is called the opening or mesh size.
Sieving a mass, m, of an aggregate on a sieve with an opening, d, separates the aggregate in two sets:
– Particles of a “size” greater than d, which remain in the sieve. This is the portion of particles retained.
– Particles of a “size” smaller than d that pass through the sieve. This is the passing or the underflow.

The sieve openings are standardized according to geometric progression. The geometric progression is characterized by the value of the base (d0 = 1 mm) and by reason, r, which allows us to deduce the openings from one another by means of the ratio di+1 = r di .
The value of the reason, r, in the series of recommended sieves according to standard NF EN 933–2 is near 21 and the values of the openings are as follows: 0.063 mm; 0.125 mm; 0.250 mm; 0.500 mm; 1 mm; 2 mm; 4 mm; 8 mm; 16 mm; 31.5 mm; 63 mm; and 125 mm.
Sieving is done manually or mechanically using a sieve stack (see Figure 2.3). The sizes of the mesh and the number of sieves are chosen according to the nature of the sample and the accuracy required. It is not necessary to use all of the possible mesh sizes to proceed to granulometric analysis of a material. The more different sieves we use, however, the more accurate the results are. Standard NF ISO 565 specifies the sizes of the intermediate sieves that can be used.
Figure 2.3. (A) Sieve; and (B) a sieve stack used for mechanical sieving (CONTROLAB)
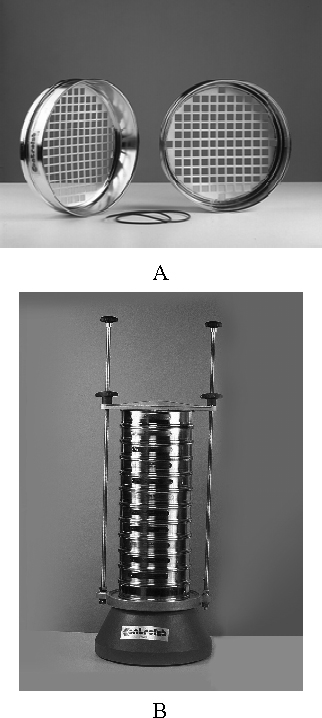
In the stack, the overlaid sieves have decreasing mesh sizes and at the bottom of the stack a “background” is placed that is used to collect the particles passing through the mesh of the smallest sieve. For instance:
– M is the mass of the sample placed at the top;
– mi is the weight of particles collected (retained) at the opening of sieve di; and
– mf is the weight of particles collected on the bottom.
We say that an aggregate is of granular class d1/d2 (or granular size [d1, d2]) if its size is between the minimum value d1 and the maximum value d2. When the values of d1 and d2 are two successive openings in the series of standard sieves, it is known as elementary aggregate.
Masses, mi, therefore correspond to granular classes di-1/di and it is possible to deduce the weight fractions of grains belonging to each granular class.
For example, the percentage of particles2 in class di-1/di is  . The percentage of particles of a smaller size in the smallest sieve is
  .
.
Typically, the results of granulometric analysis (granularity) by sieving are shown by the cumulative granular curve. It represents the variation in the grains passing (or underflow) through a sieve. These accumulate according to the size of the sieve openings in a semi-logarithmic axes system3. Figure 2.4 shows an example of the granularity of a material. Other modes of representation exist that are described at the end of this chapter.
Figure 2.4. Granularity of a material analyzed by sieving, showing its granular cumulative curve
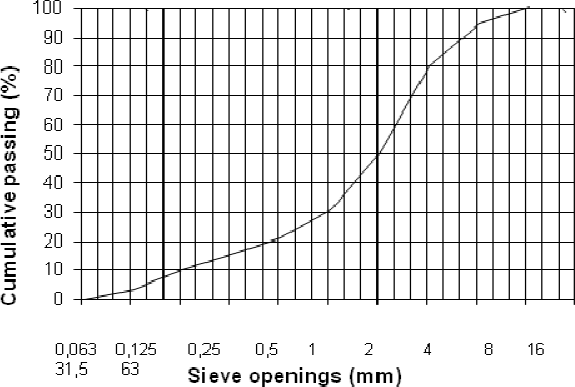
Figure 2.5. Illustration of the efficiency of sieving
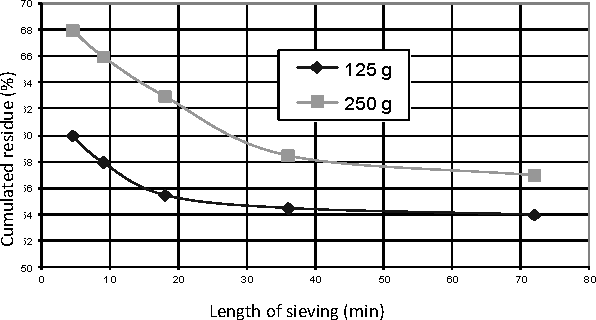
For a grain to pass through a mesh, it must be smaller than the opening but it must also present itself at the opening and this opening must be free (and therefore not a clogged sieve). The efficiency of sieving therefore depends on the quality of material being sifted (weight of sieve). In fact, the better the quality is, the greater the chance there that the openings will be clogged at the end of sieving.
This is illustrated by the results of the experiment shown in Figure 2.5. In this experiment, different masses of the same material are sifted with TYLER, an American sieve with 200 mesh openings (200 openings per inch, i.e. approximately 74 μm per opening). The material is a mixture where 50% of the particles are smaller than this opening (between 200 and 270 mesh size) and 50% are larger than it (between 150 and 250 mesh size).
The theoretical result of the sieving is therefore that 50% of the grains will pass through. The experimental curves show that we obtain 40% passing over 4.5 minutes if the aggregate mass is 125 g; whereas it requires 27 minutes for an initial mass of 250 g, which is more than double the time. Furthermore, we may note that we do not reach 50% passing after 1 hour of sieving.
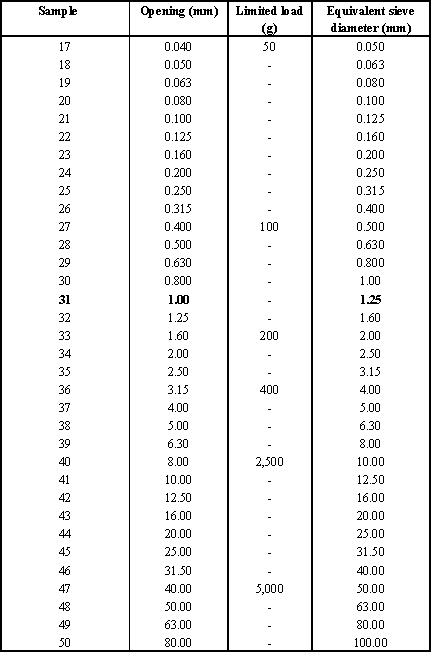
Efficiency diminishes greatly with the mass of material. In practice, we limit the mass of material by considering that the sieving must be completed in 10 min. The resulting mass limits in the sieves have values that are recorded in Table 2.1.
To avoid overloading the sieves, standard NF EN 933–2 recommends not exceeding sections A on each sieve and retaining opening d at the end of sieving:

Table 2.1. Series of sieves according to standard NF EN 933 and limited mass on sieves
When the size of the particles is very small, the sieving technique is no longer used. In fact regular weaving of sieves becomes increasingly difficult to do. Grains may agglomerate if they are not quite dry and, if they are, they may remain fixed on the sieves under the effect of the forces of electrostatic origin. The openings of sieves are therefore virtually limited to the smaller values, which are limited to this granulometric technique. For example, standard NF EN 933–2 recommends limiting the granulometric analysis by using a sieve with openings of 63 μm.
The sieving of aggregates is carried out when they are dry. Before starting to sieve, it is recommended that all small particles (smaller than 63 μm) are eliminated by sieving under water. The aggregates must be weighed after drying. Granulometric analysis is carried out on the remainder of the aggregate after drying at 110°C until a constant mass is reached.
To characterize materials whose grains are smaller, other methods must be used. They are discussed in the following sections.
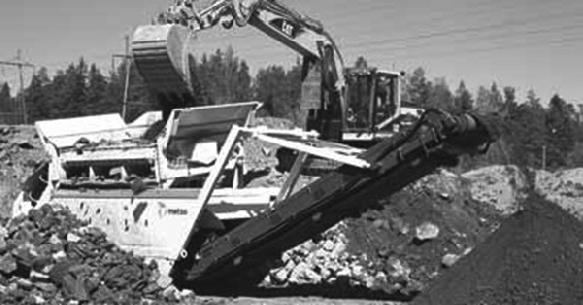
The industrial preparation of aggregates requires the production of granular denominations with adapted materials: we use screens. Screening is the name of the process of granular denominations. The function here is not to characterize the materials, but to prepare them according to size criteria. Figure 2.6 shows a screening installation. The performance evaluation of screening is the subject of Exercise 2.5 at the end of the chapter.
Figure 2.6. Screening installation
Let us consider the drop of a solid particle in a liquid:
Figure 2.7. Diagram of the solid particle gravity in a liquid
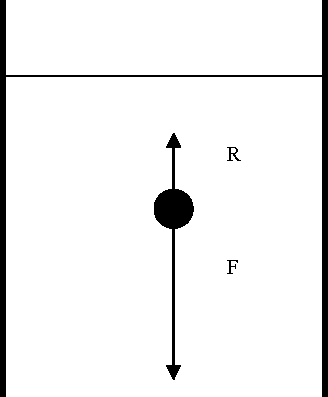
The particle is subject to two vertical opposite forces:
– R: friction force; and
– F: apparent weight.
Apparent weight, F, is given by the following ratio:
[2.5] 
where:
– ms and ml are the masses of the solid particle and that of the displaced liquid respectively;
– ρs and ρl are the densities of the solid and the liquid;
– Vp is the volume of the particle; and
– g is acceleration due to gravity.
The friction force may be expressed by the Stokes ratio if the particle is spherical (diameter D = 2r):
[2.6] 
where μ is the viscosity (dynamic) of the liquid4 (of size [M].[L]-1[T]-1) and u is the speed of the drop.
If the particle is spherical, the apparent weight is:
[2.7] 
Let us consider the drop of a spherical particle released without initial speed in the liquid. The motion of the particle is accelerated uniformly until F and R are equal and opposite. After that the motion becomes uniform. The speed limit, ulim, is given by the ratio:
[2.8] 
The speed limit is directly linked to the size of the particle. By introducing the diameter, D, it can be written:
[2.9] 