
CONTENTS
CONTRIBUTORS
PREFACE
CHAPTER ONE NERVOUS SYSTEM
SCANNING TECHNIQUE
NORMAL SONOGRAPHIC ANATOMY OF THE BRAIN
SONOGRAPHY OF BRAIN DISORDERS
INTERVENTIONAL PROCEDURES
SCANNING TECHNIQUE
NORMAL SONOGRAPHIC ANATOMY OF THE SPINE
SONOGRAPHY OF SPINAL DISORDERS
INTERVENTIONAL PROCEDURES
SCANNING TECHNIQUE
NORMAL SONOGRAPHIC ANATOMY OF PERIPHERAL NERVES
SONOGRAPHIC FEATURES OF PERIPHERAL NERVE DISORDERS
INTERVENTIONAL PROCEDURES
CHAPTER TWO EYE AND ORBIT
PREPARATION AND SCANNING TECHNIQUE
ULTRASONOGRAPHIC ANATOMY OF THE NORMAL EYE
SONOGRAPHY OF OCULAR AND ORBITAL ABNORMALITIES
INTERVENTIONAL PROCEDURES
CHAPTER THREE NECK
SCANNING TECHNIQUE
NORMAL SONOGRAPHIC ANATOMY
SONOGRAPHIC FEATURES OF NECK DISORDERS
SPECIAL PROCEDURES
CHAPTER FOUR THORAX
PREPARATION AND SCANNING TECHNIQUE
NORMAL SONOGRAPHIC ANATOMY
SONOGRAPHIC FEATURES OF THORACIC DISORDERS
INTERVENTIONAL PROCEDURES
CHAPTER FIVE HEART
ECHOCARDIOGRAPHIC TECHNIQUE
CONGENITAL HEART DISEASE
ACQUIRED HEART DISEASE
INTERVENTIONAL PROCEDURES
CHAPTER SIX LIVER
PREPARATION AND SCANNING TECHNIQUE
ULTRASONOGRAPHIC ANATOMY OF THE NORMAL LIVER
ULTRASONOGRAPHIC FEATURES OF HEPATIC DISORDERS
DISORDERS OF THE BILIARY SYSTEM
DISORDERS OF THE HEPATIC AND PORTAL VASCULATURE
INTERVENTIONAL PROCEDURES
CHAPTER SEVEN SPLEEN
PREPARATION AND SCANNING TECHNIQUE
SONOGRAPHIC ANATOMY OF THE NORMAL SPLEEN
SONOGRAPHIC FINDINGS IN SPLENIC DISORDERS
INTERVENTIONAL PROCEDURES
CHAPTER EIGHT GASTROINTESTINAL TRACT
PREPARATION AND SCANNING PROCEDURE
ULTRASONOGRAPHIC ANATOMY OF THE NORMAL GASTROINTESTINAL TRACT
SONOGRAPHIC FEATURES OF GASTROINTESTINAL DISORDERS
INTERVENTIONAL PROCEDURES
CHAPTER NINE PANCREAS
PREPARATION AND SCANNING PROCEDURE
ULTRASONOGRAPHY OF THE NORMAL PANCREAS
ULTRASONOGRAPHIC FEATURES OF PANCREATIC DISORDERS
SPECIAL PROCEDURES
CHAPTER TEN KIDNEYS AND URETERS
PREPARATION AND SCANNING TECHNIQUE
ULTRASONOGRAPHIC ANATOMY OF NORMAL KIDNEYS
ULTRASONOGRAPHIC FEATURES OF RENAL DISORDERS
DISORDERS OF THE PERINEPHRIC RETROPERITONEAL SPACE
INTERVENTIONAL PROCEDURES
CHAPTER ELEVEN BLADDER AND URETHRA
PREPARATION AND SCANNING TECHNIQUE
ULTRASONOGRAPHIC ANATOMY OF THE NORMAL URINARY BLADDER AND URETHRA
ULTRASONOGRAPHIC FEATURES OF BLADDER AND URETHRAL DISORDERS
SPECIAL PROCEDURES
CHAPTER TWELVE ADRENAL GLANDS
PREPARATION AND SCANNING TECHNIQUE
SONOGRAPHY OF THE NORMAL ADRENAL GLANDS
SONOGRAPHIC FINDINGS IN ADRENAL DISORDERS
INTERVENTIONAL PROCEDURES
CHAPTER THIRTEEN FEMALE REPRODUCTIVE TRACT
EXAMINATION TECHNIQUE
OVARIES
UTERUS
MAMMARY GLANDS
INTERVENTIONAL PROCEDURES
CHAPTER FOURTEEN MALE REPRODUCTIVE TRACT
PREPARATION AND SCANNING PROCEDURE
PROSTATE
TESTICLES
PENIS
INTERVENTIONAL PROCEDURES
CHAPTER FIFTEEN ABDOMINAL CAVITY, LYMPH NODES, AND GREAT VESSELS
PREPARATION AND SCANNING TECHNIQUE
ULTRASONOGRAPHIC ANATOMY OF THE NORMAL PERITONEAL CAVITY, FAT, VESSELS, AND LYMPH NODES
PERITONEAL EFFUSION
PERITONITIS, STEATITIS, AND PNEUMOPERITONEUM
PERITONEAL ABSCESSES, GRANULOMAS, AND PYOGRANULOMAS
NODULAR FAT NECROSIS
PERITONEAL AND RETROPERITONEAL NEOPLASIA
LYMPHADENOPATHY
VASCULAR THROMBOSIS AND OTHER ANOMALIES
INTERVENTIONAL PROCEDURES
CHAPTER SIXTEEN MUSCULOSKELETAL SYSTEM
SHOULDER
ELBOW
STIFLE
HIP
CALCANEAL TENDON (ACHILLES TENDON)
MISCELLANEOUS MUSCULOSKELETAL DISORDERS
INDEX
Dominique Penninck, DVM, PhD, is a Professor of Diagnostic Imaging in the Department of Clinical Sciences, Cummings School of Veterinary Medicine, Tufts University.
Marc-André d’Anjou, DVM, is an Assistant Professor of Diagnostic Imaging, Department of Clinical Sciences, Faculté de Médecine, Vétérinaire, Université de Montréal.
©2008 Blackwell Publishing
All rights reserved
Blackwell Publishing Professional
2121 State Avenue, Ames, Iowa 50014, USA
Orders: 1-800-862-6657
Office: 1-515-292-0140
Fax: 1-515-292-3348
Web site: www.blackwellprofessional.com
Blackwell Publishing Ltd
9600 Garsington Road, Oxford OX4 2DQ, UK
Tel.: +44 (0)1865 776868
Blackwell Publishing Asia
550 Swanston Street, Carlton, Victoria 3053, Australia
Tel.: +61 (0)3 8359 1011
Authorization to photocopy items for internal or personal use, or the internal or personal use of specific clients, is granted by Blackwell Publishing, provided that the base fee is paid directly to the Copyright Clearance Center, 222 Rosewood Drive, Danvers, MA 01923. For those organizations that have been granted a photocopy license by CCC, a separate system of payments has been arranged. The fee codes for users of the Transactional Reporting Service is ISBN-13: 978-0-8138-2800-8/2008.
First edition, 2008
Library of Congress Cataloging-in-Publication Data
Atlas of small animal ultrasonography/[edited by] Dominique Penninck, Marc-André d’Anjou.–1st ed.
p. ; cm.
Includes bibliographical references and index.
ISBN 978-0-8138-2800-8 (alk. paper)
1. Veterinary ultrasonography–Atlases. I. Penninck, Dominique. II. d’Anjou, Marc-André.
[DNLM: 1. Ultrasonography–veterinary–Atlases. 2. VeterinaryMedicine methods–Atlases. SF 772.58 A881 2008]
SF772.58A85 2008
636.089’607543–dc22
2007013146
DEDICATION
To my children, Anaïs and Loïc for their loving support, continuous encouragement and . . . patience!
To Marianne Spehl, an inspiring mentor and friend.
In memory of my father, Albert Penninck, and my nephew, Vincent Dupierreux.
Dominique Penninck
To Annabelle, Olivier, and Héloïse, for their constant love, comprehension, and energizing presence.
To all participants in our veterinary community that allow us to advance in pure mutualism.
In memory of my brother Charles.
Marc-André d’Anjou
CONTRIBUTORS
Donald Brown, DVM, PhD, DACVIM Cardiology
Associate Professor Cardiology
Department of Clinical Sciences
Tufts Cummings School of Veterinary Medicine
200 Westborough Road
North Grafton, MA 01536, USA
Nancy R. Cox, DVM, MS, PhD
Scientist, Scott-Ritchey Research Center and
Associate Professor, Department of Pathobiology
College of Veterinary Medicine
Auburn University
Auburn, AL 35849, USA
Marc-André d’Anjou, DMV, DACVR
Assistant Professor, Diagnostic Imaging
Department of Clinical Sciences
Faculty of Veterinary Medicine
University of Montreal
3200 Sicotte
Saint-Hyacinthe Quebec, Canada J2S 7C6
Hugues Gaillot, DMV
Imagerie Médicale Vétérinaire de Paris 15
10, 12 rue Robert de Flers
75015 Paris, France
John Graham, MVB, MSc, DVR, MRCVS, DACVR, DECVDI
Affiliated Veterinary Specialists,
9905 South US Highway 17-92
Maitland, FL 32751, USA
Silke Hecht, Dr.med.vet., DACVR, DECVDI
Assistant Professor of Radiology
Department of Small Animal Clinical Sciences
University of Tennessee College of Veterinary Medicine
Knoxville, TN 37996, USA
Judith A. Hudson, DVM, PhD, DACVR
Professor of Diagnostic Imaging
Department of Clinical Sciences
College of Veterinary Medicine
Auburn University
Auburn, AL 35849, USA
Martin Kramer, Dr.med.vet., PhD, DECVDI
Professor
Department of Veterinary Clinical Sciences
Clinic for Small Animals
Justus-Liebig University–Giessen
Frankfurter Str. 108
35392 Giessen, Germany
Dominique Penninck, DVM, PhD, DACVR, DECVDI
Professor Diagnostic Imaging
Department of Clinical Sciences
Tufts Cummings School of Veterinary Medicine
200 Westborough Road
North Grafton, MA 01536, USA
Kathy Spaulding, DVM, DACVR
Clinical Professor Radiology
Large Animal Clinical Sciences
College of Veterinary Medicine and Biomedical Sciences
Texas A&M University
4475 TAMU
College Station, TX 77843-4475, USA
James Sutherland-Smith, BVSc, DACVR
Assistant Professor, Diagnostic Imaging
Department of Clinical Sciences
Tufts Cummings School of Veterinary Medicine
200 Westborough Road
North Grafton, MA 01536, USA
Erik Wisner, DVM, DACVR
Professor of Diagnostic Imaging
Department of Surgical and Radiological Sciences
School of Veterinary Medicine, University of California 1
Shields Avenue
Davis, CA 95616, USA
Allison Zwingenberger, DVM, DACVR, DECVDI
Assistant Professor of Diagnostic Imaging
Department of Surgical and Radiological Sciences
School of Veterinary Medicine, University of California
1 Shields Avenue
Davis, CA 95616, USA
PREFACE
Since the start of veterinary ultrasonography in the late 1970s, many technological changes have transformed this diagnostic modality. Research and publications have enabled all sonographers to increase their level of expertise significantly. Today, ultrasonography is an integral part of the diagnostic approach in academic institutions, as well as in private practice.
The main goal of this book is to provide its readers with a vast collection of high-quality sonographic images and illustrations addressing the normal anatomy and common disorders of most body parts in small animals. These images were carefully selected or created for their teaching capability.
The choice of contributors reflects some of the international expertise available today.
We hope that this atlas will be a reference source for veterinary students, interns, and residents, as well as for radiologists, internists, and surgeons eager to learn and excel in this modality.
ACKNOWLEDGMENTS
We are pleased to acknowledge the “behind the scenes” contributions of many colleagues, technicians, students, and residents, past and present, who helped in gathering the necessary image collections to assemble this atlas. Special thanks to those at Tufts University Cummings School of Veterinary Medicine and at the Faculty of Veterinary Medicine, University of Montreal.
We express our deep gratitude also to the contributors for sharing their expertise and passion and to the publishing team at Blackwell who assisted us with this project.
Finally, we thank the many pets that patiently participated in these studies, enabling us to learn and teach with their images.
Special thanks to Beth Mellor, who produced most of the illustrations. Her artistic talent has greatly enhanced the mission of this book.
The brain of most small animals can be imaged adequately with a high-frequency transducer (7.5–10 MHz) to provide the best resolution. The use of a lower-frequency transducer (3–5 MHz) may also be necessary in large dogs or in dogs with thick bone. Although sector scanners, linear array transducers, and curvilinear array transducers all can be used, sector scanners and curvilinear array transducers provide better visualization of peripheral structures. A small footprint is also helpful.
Sedation is usually not necessary. Most small animals can be imaged while wrapped in a warm towel and held gently in the sonographer’s lap. Fur can usually be parted for the acoustic gel to be applied. In some individuals with a thick hair coat, clipping may improve the quality of the images.
In young puppies, the bregmatic fontanel can be used as an acoustic window to the brain up to approximately 1 month of age (Hudson et al. 1991). In some individuals, particularly in toy-breed dogs, the bregmatic fontanels may persist into adult life. A kitten’s brain can be imaged through the fontanel up to about 5 months of age although accessibility decreases over time (Jäderlund et al. 2003). Unless the fontanel or defect is very large, the tip of the transducer must be held relatively stationary; the transducer can slide only a short distance. The brain is imaged by using a “windshield wiper” technique, with the tip of the probe acting as a pivot point to scan from rostral to caudal and back to obtain transverse images and from side to side to obtain longitudinal images. Because the probe is usually angled to view rostral and caudal structures, most images are made in oblique rather than perpendicular planes (Figure 1.1). Therefore, it should be remembered that, in rostral transverse images, ventral structures seen are actually located rostrally to dorsal structures in the image whereas, in the caudal transverse images, the ventral structures are located caudally to dorsal structures seen in the image.
In absence of a fontanel, a lower-frequency transducer (e.g., 5 MHz) can be used to penetrate the skull, enabling partial visualization of the brain. Penetration of the temporal bone can be used for this purpose in some small dogs in which the brain cannot be otherwise imaged (Figure 1.2A).
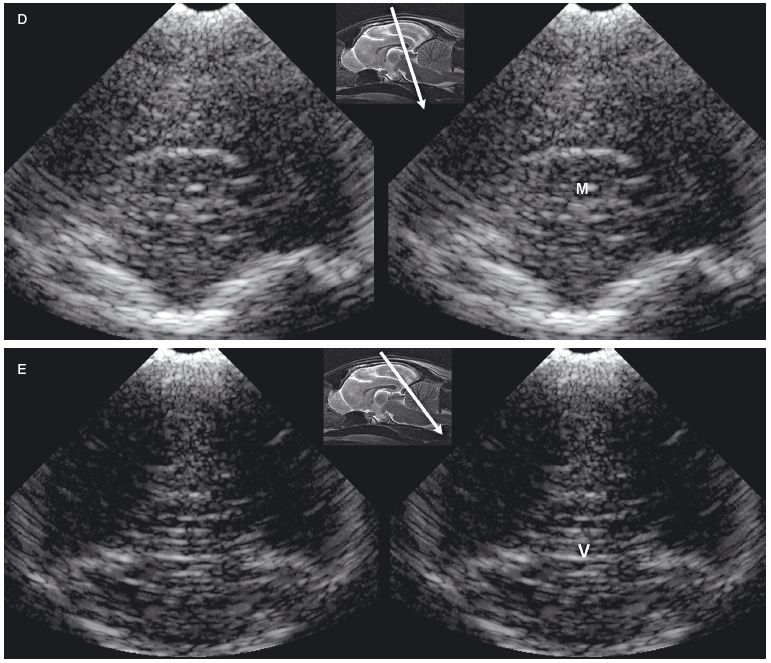
Visualization of caudal structures of the brain can be achieved by imaging at the foramen magnum (Figure 1.2B).
Craniotomy sites, and defects caused by trauma or disease, can be used in imaging the brain. Prenatal neurosonography is common in human medicine but is seldom used in animals. The brain of unborn puppies and kittens can be evaluated in utero, however. Prenatal sonographic diagnosis of hydranencephaly has been reported (Cruz et al. 2003). Based on findings in human patients, ultrasound images of the brain of puppies and kittens in late gestation in utero should enable the detection of other major defects in brain development, such as anencephalies, encephaloceles, and meninogoceles.
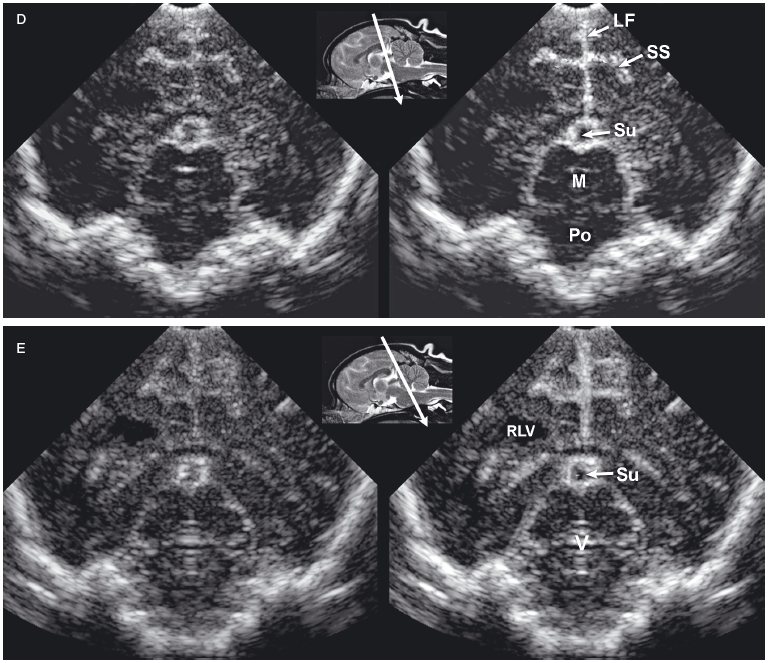
The sonographic anatomy of the brain of normal dogs has been described (Hudson et al. 1989) (Figure 1.3). The longitudinal fissure and splenial sulci form a hyperechoic umbrella-like structure that can be used as a landmark to locate the midline of the brain. This is particularly useful when a natural or created defect in the skull is located asymmetrically. The cingulate gyrus is found deep to each splenial sulcus. Rostrally, the caudate nuclei are recognizable as hyperechoic curved structures. The lateral ventricles are located medial to the caudate nuclei and vary greatly in size according to the breed, age, and individual. Asymmetry is common. Cerebrospinal fluid (CSF) is anechoic and may cause the lateral ventricles to appear as small anechoic slits in some individuals.
Figure 1.1. Normal brain in a dog and ultrasound beams resulting in planes 1 and 2. A: Sagittal magnetic resonance image of the brain of a normal golden retriever illustrating how the ultrasound beam (planes 1 and 2 represented by the arrows) passes through the brain when the beam is placed over the fontanel to obtain transverse sonograms. B: Plane 1 shows the ultrasound beam angled perpendicular to the long axis of the brain to image the rostral horns of the lateral ventricles. C: Plane 2 shows the ultrasound beam angled caudally to image the third ventricle and mesencephalon. D: Transverse magnetic resonance image of the brain of a normal dog showing the axis of an ultrasound beam over the fontanel to obtain midline and parasagittal sonograms (arrows).
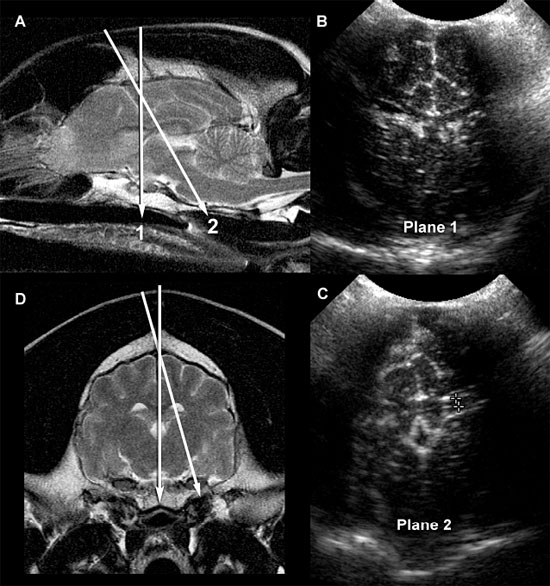
Figure 1.2. A: Hydrocephalus. Transverse magnetic resonance image of a dog with hydrocephalus showing the axis of an ultrasound beam to obtain parasagittal images (arrows and corresponding planes 1 and 2). Plane 1 shows the beam angled laterally to obtain a parasagittal image. Plane 2 shows the axis of the beam to image the brain through the temporal bone. 3, third ventricle; CN, caudate nucleus; LLV, left lateral ventricle; and T, thalamus. B: Foramen magnum window. Sagittal magnetic resonance image of a cat showing the axis of the ultrasound beam (arrow) for imaging of the brain through the foramen magnum. The plane of the ultrasound beam passes through the cerebellum and midbrain. A sonogram of a normal cat made through the foramen magnum is on the bottom right. A histological image made in a similar plane is on the bottom left. M, midbrain; and V, vermis.
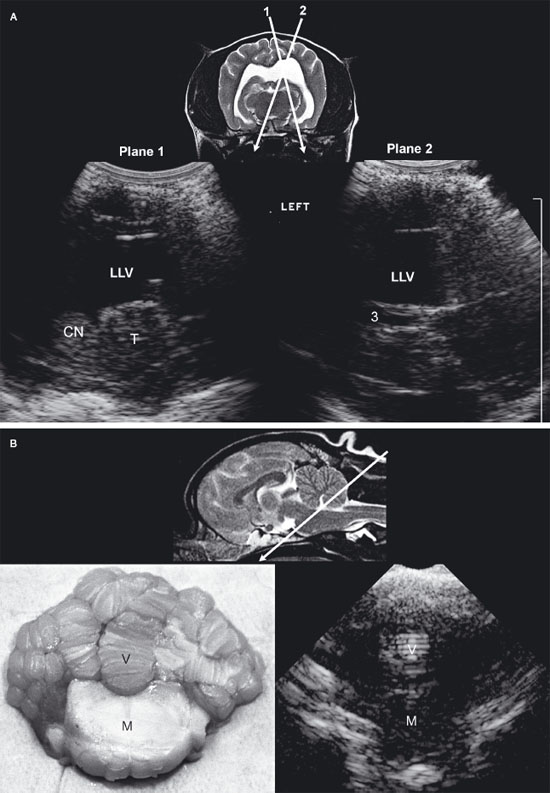
Figure 1.3. Transverse sonograms of the brain of a 1-month-old Yorkshire terrier. The ventricles are asymmetrical but within normal limits. A: Rostral sonogram. B: Sonogram at the level of the interthalamic adhesion. C: Sonogram at the level of the third ventricle. D: Sonogram with the ultrasound beam angled caudally to image the mesencephalon. E: Sonogram with the ultrasound beam angled caudally to image the cerebellum. 3, third ventricle; CC, corpus callosum; CG, cingulate gyrus; CN, caudate nucleus; F, fornix; H, hippocampus; IA, interthalamic adhesion; LF, longitudinal fissure; LLV, left lateral ventricle; M, mesencephalon; P, pyriform lobe; Po, pons; RLV, right lateral ventricle; SS, splenial sulcus; Su, subarachnoid space; T, thalamus; and V, vermis.
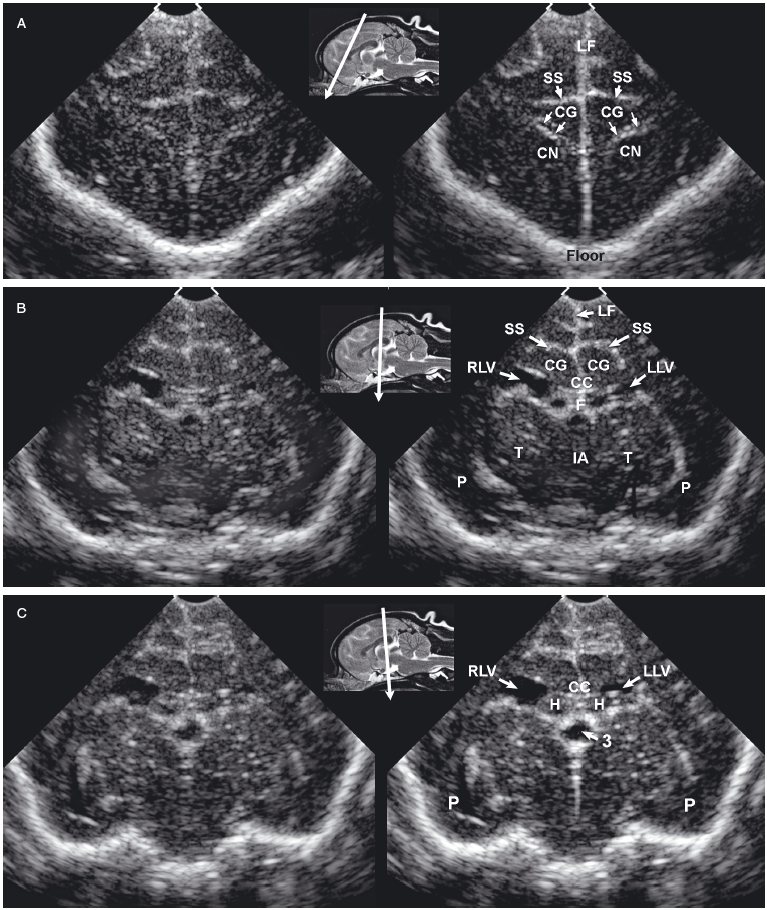
As the beam is swept slightly more caudally, the rostral fornix comes into view. Choroid plexus is hyperechoic while it lies on the floor of the central portion of the lateral ventricle and the roof of the temporal horn. It may be difficult to distinguish between the caudate nucleus and the adjacent choroid plexus in the lateral ventricle, so only a single hyperechoic focus might be seen on each side of the midline in some dogs. If there is sufficient CSF, the lateral ventricle can be seen.
In older puppies and adult dogs, alternating hyperechoic and hypoechoic lines represent the callosal sulcus, corpus callosum, and fornix. Comparison with histological samples suggests that the most superficial hyperechoic layer is the callosal sulcus, which contains vessels that pulsate. The corpus callosum is comprised of a hypoechoic surface with a deeper hyperechoic border. The fornix is hypoechoic. In the first few days of life, these structures may appear only as a single hyperechoic region. Detail improves as myelination progresses after birth. Most of the brain is uniformly hypoechoic, but the pyriform lobes are visible because of hyperechoic meninges dorsal to each lobe.
When the probe is tilted to sweep the ultrasound beam caudally, the dorsal portion of each hippocampus appears as a hypoechoic structure close to the midline. Dorsolateral to each of these structures, a hyperechoic area represents choroid plexus in each lateral ventricle. Another hyperechoic area is seen in the midline ventral to the level of the dorsal portions of the hippocampi. Depending on the angle of ultrasound section, this hyperechoic area may represent choroid plexus in the dorsal portion of the third ventricle or pia mater that is located more caudally in the adjacent subarachnoid space. Vessels and trabeculae in the subarachnoid space may create a complex of echoes that outline the mesencephalon and cause it to appear as a dome-shaped hypoechoic structure. The petrous temporal bones will create irregular hyperechoic echoes on the floor of the cranium on each side of the midline deep to the hypoechoic pyriform lobes.
More caudally, the osseous tentorium is a hyperechoic structure shaped like an inverted V. In older animals, this structure often prevents visualization of the caudal brain, but the medulla and cerebellum can be imaged in neonatal animals. The medulla is hypoechoic. The vermis of the cerebellum is represented by a stack of hyperechoic lines seen in the midline. Each lateral cerebellar hemisphere is located more laterally as a hypoechoic structure.
Longitudinal images made near the midline are true sagittal images, but when the probe is moved past the edge of the fontanel, the probe must be angled to enable the beam to reach the lateral margins of the brain. The floor of the cranium appears curved in images showing the lateral portions of the brain, whereas the floor of the cranium is more irregular in images made near the midline (midsagittal images). As the probe is angled laterally, structures that are anatomically closer to the midline appear in the near field of the ultrasound image, whereas more lateral structures are seen in the far field (Figure 1.4).
The interthalamic adhesion and, more caudally, the mesencephalon can be seen in midsagittal images as hypoechoic structures surrounded by echoes created mainly by choroid plexus in the third ventricle and meninges and in vessels in the subarachnoid space. In some areas, the third ventricle will appear anechoic or hypoechoic because of the presence of CSF. The osseous tentorium is incompletely ossified in neonates, enabling visualization of hyperechoic echoes created by the vermis in the posttentorial area of the brain. More superficially, the callosal sulcus is seen as a hyperechoic line. The corpus callosum has an appearance similar to that seen in transverse images. It is hypoechoic, with a deep hyperechoic interface.
When the probe is angled to obtain a lateral parasagittal image, the subarachnoid space and third ventricle are no longer seen; the thalamus and lateral ventricle are now visible on the imaged side. The thalamus appears as a hypoechoic structure outlined by hyperechoic choroid plexus in the lateral ventricle. Areas of the lateral ventricle with sufficient CSF may appear anechoic or hypoechoic. The caudate nucleus is imaged rostral to the thalamus as a hypoechoic structure with increased echogenicity superficially. This structure is more apparent in older dogs than in neonates. The thalamocaudate groove is seen between the thalamus and caudate nucleus. This groove is more apparent in older dogs, but in neonates a hyperechoic clump of choroid plexus is often seen in the lateral ventricle in this region. Care should be taken not to mistake this normal appearance for intraventricular hemorrhage that is also hyperechoic. In lateral parasagittal images, the splenial sulcus is seen in addition to the callosal sulcus and corpus callosum and appears as an undulating hyperechoic line. The cingulate gyrus shows as a hypoechoic structure deep to the splenial sulcus.
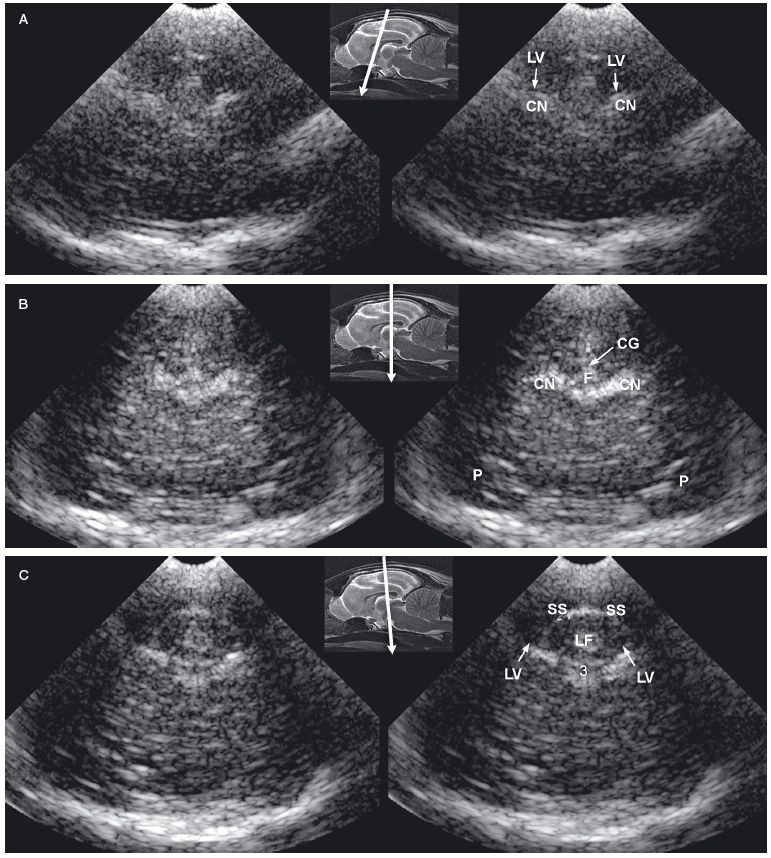
The feline brain can be evaluated by using transverse and longitudinal sonographic planes (Figures 1.5 and 1.6).
The lateral ventricles are slitlike in kittens. In some normal magnetic resonance images of the adult feline brain (Hudson et al. 1995), the lateral ventricles cannot be discerned. Using ultrasound, measurement of lateral ventricles is also more problematic in cats than in dogs because landmarks such as the thalamocaudate groove and the interthalamic adhesion are less recognizable (Jäderlund et al. 2003). In the study by Jäderlund and colleagues, the most reliable and repeatable measurements were obtained by measuring the central portion of the lateral ventricle in parasagittal views angled 5°–10° from the midline. In these images, the dorsal and ventral walls of each lateral ventricle were parallel to each other, but the walls on each side were perpendicular to the ultrasound beam (Figure 1.6). The caudal portion of each lateral ventricle was larger than the more rostral portions, which provided clear visualization in parasagittal scans. Curving of the occipital horn made accurate measurement difficult, however. Difficulty was also experienced when measuring the lateral ventricles in transverse images. Measurement was recommended at the junction of the sella turcica and the cranial fossa to provide a landmark for greater repeatability, but the ventricular walls were at a slightly oblique angle to the beam in transverse images at this level.
Figure 1.4. Sagittal to parasagittal sonograms of the brain of a normal 1-month-old Yorkshire terrier. A: Midline sagittal sonogram. B: Parasagittal sonogram with the ultrasound beam angled laterally to image the right lateral ventricle. C: Parasagittal sonogram with the ultrasound beam angled laterally to image the left lateral ventricle. C, cerebellum; CG, cingulate gyrus; CN, caudate nucleus; F, fornix; H, hippocampus; IA, interthalamic adhesion; L, left; M, mesencephalon; R, right; RLV, right lateral ventricle; SS, splenial sulcus; and T, thalamus.
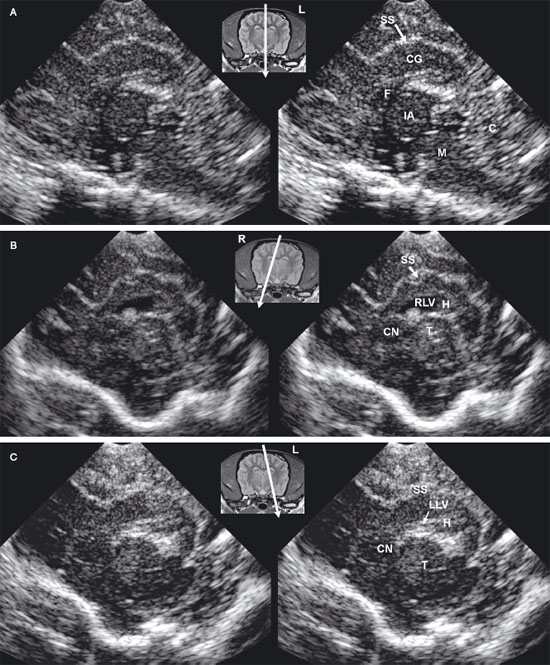
Figure 1.5. Transverse sonograms of the brain of a normal 1-week-old kitten. The ventricles in a kitten are slitlike and much smaller than those of a puppy. A: Rostral sonogram showing the caudate nuclei and lateral ventricles (arrows). B: Sonogram with the ultrasound beam perpendicular to the brain. C: Sonogram at the level of the third ventricle. D: Sonogram at the level of the mesencephalon. E: Sonogram with the probe angled caudally to image the cerebellum. The vermis appears as a series of stacked linear echoes. 3, third ventricle; CC, corpus callosum; CG, cingulate gyrus; CN, caudate nucleus (plus the choroid plexus in the lateral ventricle); F, fornix; LF, longitudinal fissure; LV, lateral ventricle; M, mesencephalon; P, pyriform lobe; SS, splenial sulcus; and V, vermis.
In dogs, the internal carotid artery enters the cranial vault and divides into the rostral cerebral artery, the middle cerebral artery, and the caudal communicating artery (Schaller 1992) (Figure 1.7).
The rostral cerebral artery runs rostrally and dorsally and then curves caudally along the medial aspect of the hemisphere. The artery anastomoses with a branch of the caudal communicating artery that supplies the caudomedial portion of the cerebrum. The middle cerebral artery sends central branches that enter the midportion of the brain. A lateral branch supplies the surface of the brain. In the area of the spine, the vertebral arteries unite to form the basilar artery, which enters the brain caudally and divides into the right and left caudal communicating arteries. Each caudal communicating artery connects the basilar artery with the ipsilateral internal carotid artery.
Cats differ from dogs in that the terminal extracranial portion of the internal carotid artery is regressed (Figure 1.8).
In cats and dogs, the ascending pharyngeal artery arises from the external carotid artery and runs rostrally to anastomose with the internal carotid artery, but, in cats, the ascending pharyngeal artery is a major source of blood to the brain.
Color flow Doppler imaging can be used to image the cerebral arteries, particularly the rostral cerebral artery and the central branch of the middle cerebral artery. Velocities in these vessels can be measured by switching the sonographic mode to pulsed-wave or continuous-wave Doppler imaging. The most accurate measurements are made from sagittal images because the sonographer can ensure that the Doppler angle (the angle between the path of the ultrasound beam and the direction of flow) is as close to zero as possible. Velocities are likely to be underestimated when made from transverse images, because the Doppler angle cannot be accurately measured. Nevertheless, in some cases, transverse images must be made because the sonographic window is too small and the probe too large to enable sonographers to tilt the probe adequately to obtain parasagittal images of the rostral brain. Although the Doppler cursor is best placed using the color flow Doppler image as a guide, pulsations can be seen on gray-scale images, and the Doppler cursor can be placed on these pulsations to obtain velocity measurements (Hudson et al. 1997).
Figure 1.6. Sagittal to parasagittal sonograms of the brain of a normal 1-week-old kitten. A: Midline sagittal sonogram. B: Parasagittal sonogram with the beam angled lateral to the midline. CS, callosal sulcus; F, fornix; H, hippocampus; IA, interthalamic adhesion; LV, lateral ventricle; SS, splenial sulcus; and T, thalamus. The arrow in the magnetic resonance image insert shows sagittal and parasagittal planes corresponding to the sonograms.
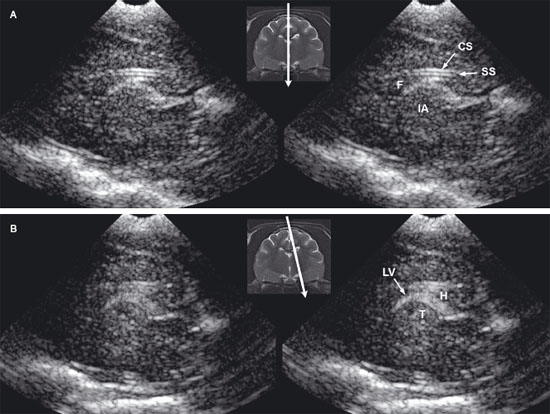
Figure 1.7. Sonograms with color Doppler imaging to show the vasculature of the brain of a normal dog. A: Parasagittal sonogram showing the branches of the internal carotid artery. B: Parasagittal sonogram of the brain showing placement of the pulsed Doppler cursors on the rostral cerebral artery. C: Transverse sonogram of the rostral brain showing the dorsal portion of the rostral cerebral artery (R). The electronic cursors have been placed to measure velocity and calculate the resistance index from the Doppler waveform. Arrows indicate the location of the lateral ventricles. ACC, branch of the rostral cerebral artery (artery along the corpus callosum); CB, callosal branches; ICA, internal carotid artery; MCA, middle branch of the middle cerebral artery; and RCA, rostral cerebral artery.

Figure 1.8. Sonograms made using color Doppler imaging to show the vasculature of the brain of a normal cat. A: Parasagittal sonogram showing the branches of the internal carotid artery. B: Parasagittal sonogram of the feline brain showing placement of the pulsed Doppler cursors on the rostral cerebral artery. A normal waveform is shown. C: Sonogram of the caudal aspect of the brain made through the foramen magnum showing the pulsed Doppler cursor placed on basilar artery. The resistance index can be calculated from the peak systolic and diastolic velocities. The ascending pharyngeal artery anastomoses with the internal carotid artery becoming a major source of blood to the brain. A portion of the extracranial internal carotid artery is not patent. ACC, branch of the rostral cerebral artery (artery along the corpus callosum); BA, basilar artery; ICA, internal carotid artery; RCA, rostral cerebral artery; and T, thalamus.

Evaluation of vessels may be helpful when the brain is injured or is damaged by disease. Color flow Doppler imaging can be used to identify overcirculated or undercirculated areas. The resistance index (RI) is calculated as the following ratio:
(systolic velocity − diastolic velocity)/diastolic velocity
High RI may be associated with a poor prognosis in some disease processes (Saito et al. 2003).
The most common application of neurosonography of the brain is to measure ventricular size when diagnosing hydrocephalus. Other applications include evaluation of animals with traumatic cranial defects for evidence of hemorrhage or infection, intraoperative or postoperative examination of brain neoplasms, and imaging of masses associated with bony lysis. Additionally, ultrasound can be used to guide biopsy or fine-needle aspiration of brain lesions or to guide injection of substances into the brain.
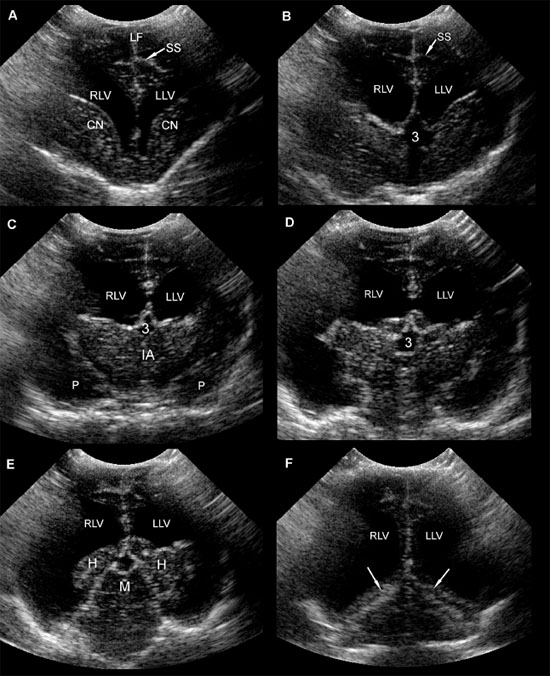
Hydrocephalus can be congenital or acquired. The disorder is common in toy-breed dogs, which may have persistent fontanels (Figure 1.9).
It should not be assumed that a dog has hydrocephalus merely because there is a persistent fontanel. Not all toy-breed dogs with a persistent fontanel have hydrocephalus, and, conversely, toy-breed dogs can have hydrocephalus without having a persistent fontanel. In some toy-breed or small breed dogs without a persistent fontanel, the temporal bone is thin enough to allow transcranial imaging. In addition, limited imaging of the caudal fossa can be achieved using the foramen magnum. Because the fontanel ossifies in many larger dogs, other imaging modalities may be necessary to examine the brain for hydrocephalus in these dogs after the first few weeks of life.
Figure 1.9. Sonograms of a 1-year-old Chihuahua with severe ventriculomegaly. A: Rostral sonogram showing the caudate nuclei and lateral ventricles. B: Sonogram made at the level of the rostral portion of the third ventricle. C: Sonogram made at the level of the thalami. D: Sonogram made at the level of the pituitary gland. Notice the irregularity of the floor of the cranium at this level. E: Sonogram made with the ultrasound beam pointed caudally to display mesencephalon. F: Sonogram showing the osseous tentorium (arrows). 3, third ventricle; CN, caudate nuclei; H, hippocampus; IA, interthalamic adhesion; LF, longitudinal fissure; LLV, left lateral ventricle; M, mesencephalon; P, pyriform lobe; RLV, right lateral ventricle; and SS, splenial sulcus on the left side.
Acquired hydrocephalus can be caused by obstruction at various locations in the ventricular system. Neoplasia, hemorrhage (including intraventricular hemorrhage in the perinatal period), and infection are among the possible causes of obstruction. Location of the obstruction dictates the pattern of dilation of the ventricular system; therefore, a finding of asymmetrical dilation recognizable via ultrasound images can assist in determining the focus of the obstruction. Interference with absorption of CSF from the subarachnoid space into the venous system can cause non-obstructive hydrocephalus. Ex vacuo hydrocephalus is caused by the atrophy or failure of the brain to develop (Ettinger and Feldman 2005).
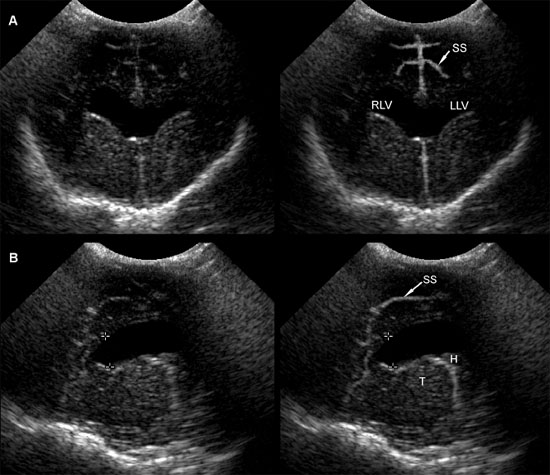
Several methods have been proposed for evaluating enlarged lateral ventricles on sonograms (Figure 1.10 and Table 1.1). The degree of ventriculomegaly ranges from the ventricles being only slightly enlarged to ventricles occupying most of the brain. Midline structures between the lateral ventricles are intact in some animals, but the lateral ventricles become confluent in others (Figure 1.11).
Several studies using ultrasonography or magnetic resonance imaging (MRI) have shown that the severity of clinical signs is not directly related to the degree of ventriculomegaly, and ventriculomegaly can be seen in neurologically normal dogs (De Haan et al. 1994; Vullo et al. 1997). A study using MRI to compare ventricular volume in Yorkshire terriers to that in German shepherds indicated that percentage of ventricle area to hemispheric area was significantly greater in the Yorkshire terriers, but the range of ventricle area for neurologically normal Yorkshire terriers overlapped that of neurologically abnormal Yorkshire terriers (Estave-Ratsch et al. 2001). Ventriculomegaly should not be equated with clinically significant hydrocephalus (Hudson et al. 1990; Spaulding and Sharp 1990; Ettinger and Feldman 2005). Breed differences and severity of clinical signs should be considered. Measurement of blood flow in the basilar artery might help to identify animals in which enlarged ventricles are significant or are likely to become clinically significant (Saito et al. 2003). In one study, RI at the basilar artery was higher in dogs with clinical hydrocephalus or other brain disease compared with normal dogs or dogs with asymptomatic hydrocephalus. Additionally, asymptomatic dogs with severe ventriculomegaly and high RI later developed clinical signs, although the use of high RI by itself did not identify asymptomatic dogs that were likely to become symptomatic (Saito et al. 2003).
Table 1.1. Guidelines for measurements of the ventricular system as currently available in the literature
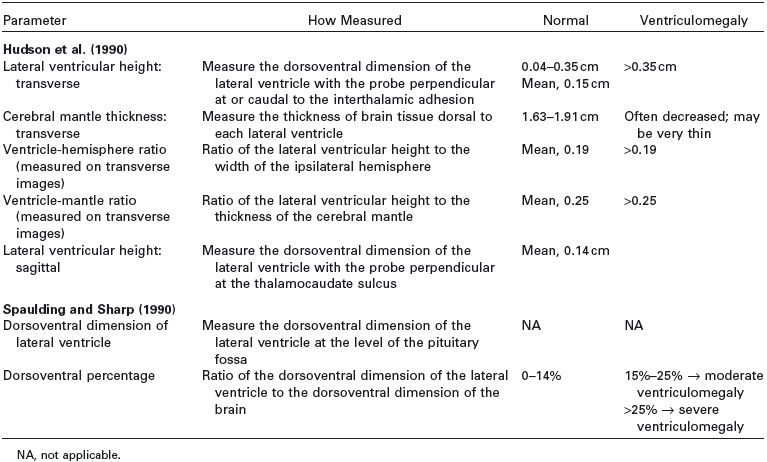
Figure 1.10. Measurement of the lateral ventricles in a 3-month-old Chihuahua. A: Transverse sonogram at the level of the interthalamic adhesion showing measurement using the method of Hudson et al. (1990) The lateral ventricular height can be compared with the cerebral mantle thickness (the thickness of the parenchyma dorsal to the lateral ventricle) to obtain the ventricle-mantle ratio. B: Transverse sonogram at the level of the pituitary gland showing measurement by using the method of Spaulding and Sharp (1990). Another method of measurement calculates the dorsoventral measurement of the lateral ventricle as a percentage of the dorsoventral measurement of the brain. RLV, right lateral ventricle.
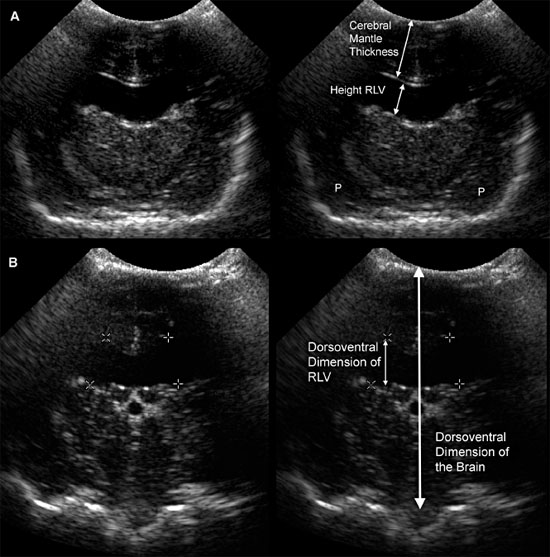
Figure 1.11. Variability in expansion of the ventricular system in hydrocephalus. Additional images from the brain of the 3-month-old Chihuahua shown in Figure 1.10 indicate that the temporal horns are minimally affected, but there is a confluence of the rostral horns. The third ventricle is not enlarged. Sonograms of another Chihuahua in Figure 1.9 show that ventriculomegaly involves the temporal horns, as well as rostral horns and central parts, and there is enlargement of the third ventricle in that dog. Midline structures remain mainly intact, however. A: Rostral transverse sonogram. B: Parasagittal sonogram. H, hippocampus; LLV, left lateral ventricle; RLV, right lateral ventricle; SS, splenial sulcus; and T, thalamus.
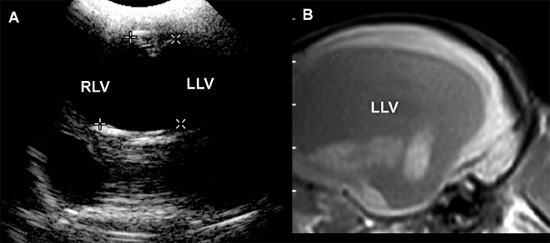
It may also be useful to evaluate the amount of brain tissue spared by the dilated ventricles. Animals with very little brain tissue commonly have severe neurological deficits, although that is not always true (Figure 1.12).
The suggested methods of measurement are not always useful (Table 1.1). Some animals may have minimal enlargement in the described planes for measurement but have greatly enlarged ventricles in other areas, such as the caudal part of the central horn and the temporal horn. The third or fourth ventricles may also be enlarged. Sonographers should be careful to record these findings, as well as any other abnormalities, including additional anomalies or masses that may be related to the ventriculomegaly.
Figure 1.12. Incidental ventriculomegaly. Sonogram and magnetic resonance image (MRI) of the brain of a 10-year-old Maltese with severe but incidental ventriculomegaly. The ventriculomegaly was noted during spinal MR imaging performed to evaluate intervertebral disc herniation in the cervical region. The dog was not showing clinical evidence of brain abnormalities. A: Transverse sonogram showing massive ventriculomegaly involving the right and left lateral ventricles (RLV and LLV, respectively). B: Parasagittal MRI showing a severely dilated left lateral ventricle (LLV).
In most animals with brain neoplasia, MRI or computed tomography is used to make the initial diagnosis because the thick bone of the cranium precludes diagnosis with ultrasonography. Ultrasonography is more likely to be used either intraoperatively or postoperatively, although a window might provided by a persistent fontanel or by bone lysis associated with a neoplasm (Figure 1.13).
Most neoplasms in people and animals are hyperechoic to the adjacent normal brain.
Ultrasonography can assist in defining the borders of a mass intraoperatively so that most or all of the abnormal tissue can be removed. The vessels associated with a mass or other lesion can also be evaluated. Ultrasound-guided biopsy can be performed if the nature of a lesion is questionable. This enables preliminary diagnosis to establish the neoplastic or nonneo-plastic nature of the lesion and establish a prognosis and selection of treatment. If a cranial defect remains following surgical intervention, ultrasonography can be used to follow the patient postoperatively to determine response to therapy.
In rare instances, a brain abscess or granulomatous mass might occur in either a very young animal or an older animal with a persistent fontanel or other cranial defect (Klopp et al. 2000). Abscessation can appear as a cavitary and hypoechoic lesion containing swirling cellular material compressing the surrounding brain parenchyma (Figure 1.14).
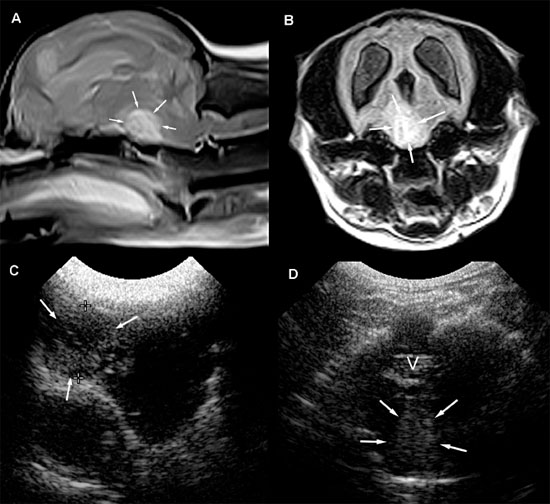
In case of organized granuloma, a well-marginated hyperechoic lesion can be detected. Thus, a granulomatous mass should be considered as a differential diagnosis for neoplasia when a hyperechoic mass is seen on ultrasonography (Figure 1.15).
Ultrasonography is used to examine the brain of animals with traumatic cranial defect to determine whether hemorrhage has occurred. Comatose or semicomatose animals can be evaluated for evidence of active hemorrhage requiring surgical intervention if a suitable sonographic window is available (Figure 1.16).
Figure 1.13. Astrocytoma in the cerebellum of an 8-year-old terrier. A: Magnetic resonance image shows a hyperintense mass (M) in the cerebellum. A craniotomy was done to enable an intraoperative ultrasound-guided biopsy of the mass. B: Transverse (trans) sonogram showing the hyperechoic mass (between the cursors) in the cerebellum. C: Parasagittal (long) sonogram showing the cerebellar mass. Images courtesy of D. Penninck and S. Hecht.
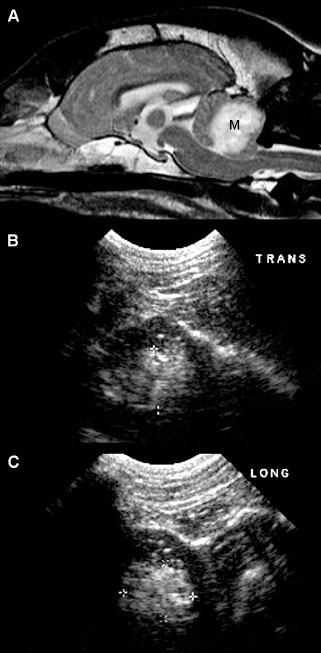
Figure 1.14. Abscess in the cerebrum of a kitten. The kitten had ventrolateral strabismus and soft-tissue swelling on its head. An abscess was diagnosed and drained via a palpable fontanel. A: Transverse ultrasonographic plane showing a large pocket of cellular fluid within the cerebrum (arrows). B: Transverse postcontrast computed tomography, on which a large, heterogeneous, contrast-enhancing mass lesion is observed (arrows).
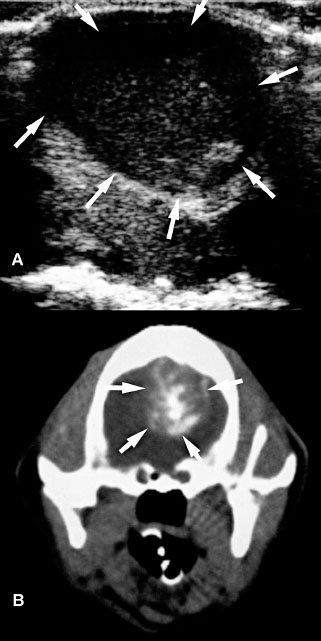
Figure 1.15. Granulomatous meningoencephalitis in a 5-year-old Yorkshire terrier. A mass was identified in the brain stem and subsequently biopsied. The mass could be seen with ultrasonography performed at the foramen magnum although ventriculomegaly was not apparent from that location. A: Sagittal T1-weighted magnetic resonance image after intravenous administration of gadolinium showing a hyperintense lesion in the rostral brain stem (arrows). B: Transverse T2-weighted magnetic resonance image showing a hyperintense lesion in the brain stem to the right of the midline (arrows). The lateral and third ventricles are dilated. C: Sagittal sonographic image obtained through the foramen magnum. Cursors have been placed to measure the mass (arrows). D: Transverse sonographic image obtained through the foramen magnum. In the brain stem is a hyperechoic mass (arrows) just ventral to the cerebellar vermis (V).
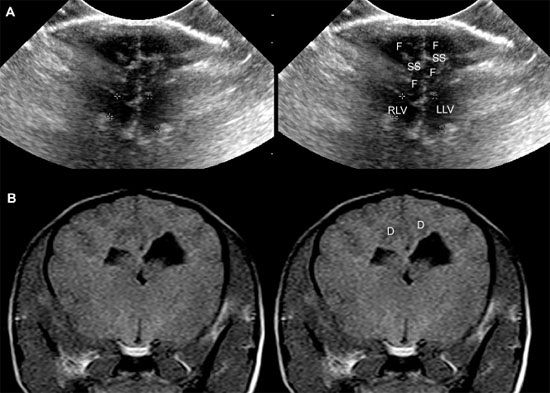
Bleeding into the brain is usually seen immediately as a hypoechoic area, but erythrocyte aggregation causes a lesion to become hyperechoic. As the clot breaks down, anechoic or hypoechoic areas may be seen (Figure 1.17).
Serial sonograms enable continuing evaluation of patients without anesthesia and with little stress to the patients. Recheck ultrasonographic evaluation is warranted especially when patients have changed mentation.
Figure 1.16. Sonograms of the brain of a puppy hit by a car and comatose. On these transverse (A) and parasagittal (B) sonograms, there is thickening of the splenial sulci (SS) suggesting localized hemorrhage. Other areas of the brain appear normal, and the patient recovered uneventfully. LF, longitudinal fissure; LV, choroid plexus in the lateral ventricle; LLV, area of the left lateral ventricle; RLV, area of the right lateral ventricle; SS, splenial sulcus; and T, thalamus.
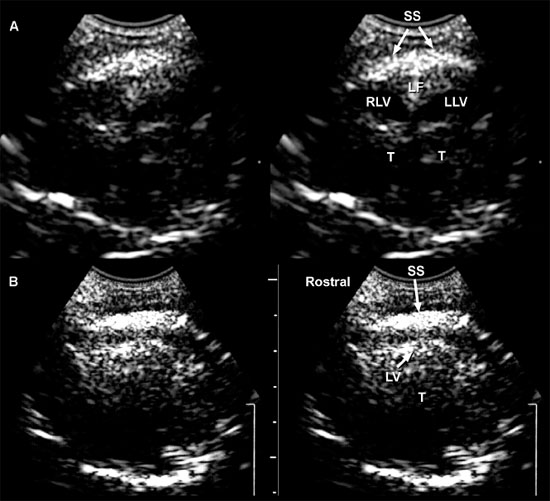
Figure 1.17. Head trauma in a 4-year-old Chihuahua. A: Transverse sonogram of the brain after head trauma and subsequent seizures. The dog was in lateral recumbency and was minimally responsive. A collection of fluid (F) surrounds the splenial sulcus (SS) on each side. The right splenial sulcus is displaced ventrally. The right lateral ventricle (RLV) and left lateral ventricle (LLV) are mildly dilated. B: T1-weighted magnetic resonance image showing decreased signal intensity (D) in the region of the splenial sulci.
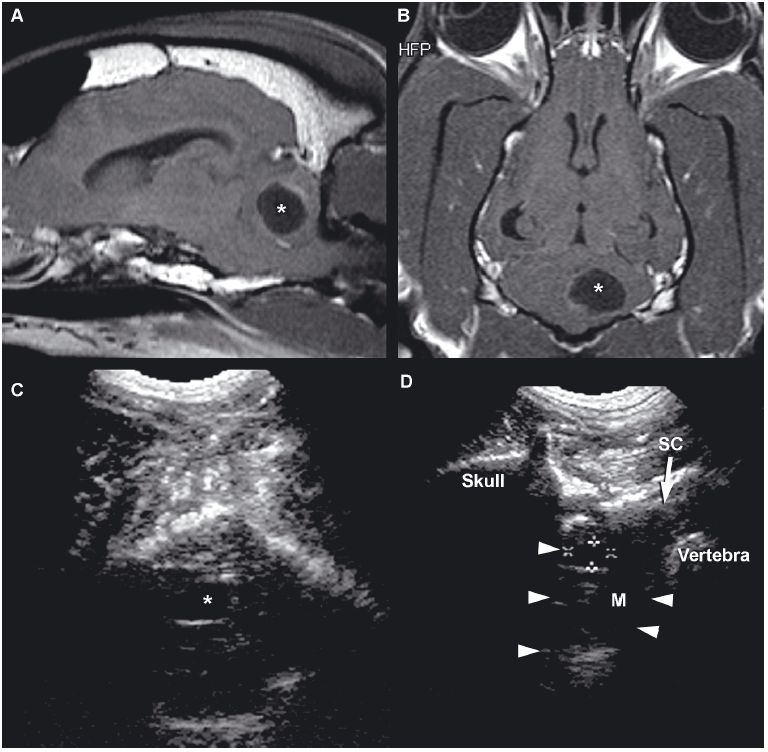
Cystic lesions can be produced by infectious disease or neoplasia or may have no apparent cause (Cruz et al. 2003) (Figure 1.18).
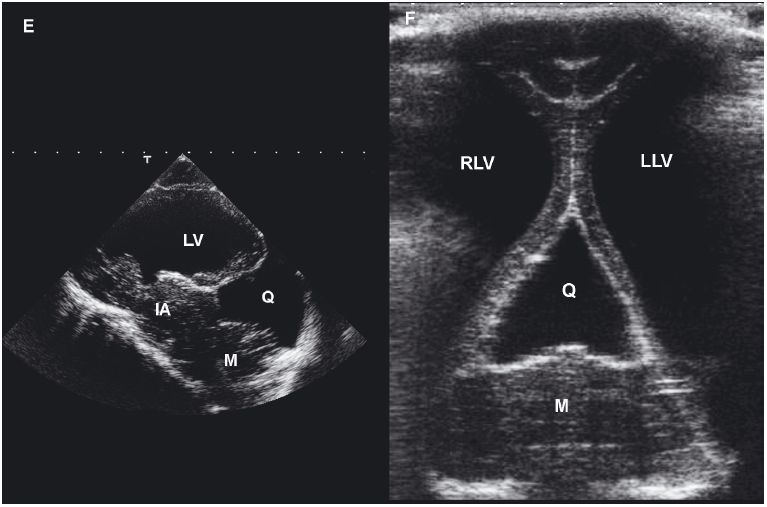
Choroid plexus cysts, intracranial arachnoid cysts, and epidermoid and dermoid cysts associated with the fourth ventricle, quadrigeminal cistern, or cerebellopontine angle have been reported. Arachnoid cysts are seen most commonly in the quadrigeminal cistern, where they appear as a well-defined anechoic mass between the caudal aspect of the cerebral hemispheres. The midbrain will be found ventral to the cyst, and the cerebellum will be caudal (Saito et al. 2001). Congenital cysts secondary to abnormal development or destruction of brain parenchyma, such as in Dandy-Walker syndrome and porencephaly or hydranencephaly, can also occur. Hydranencephaly is diagnosed when the cerebral hemispheres are absent or almost completely absent (Cruz et al. 2003).
Figure 1.18. Cyst in the cerebellum of an 8-year-old terrier. The cyst was drained surgically, but an astrocytoma was later diagnosed at the site (as seen in Figure 1.13). A and B: Sagittal and dorsal postcontrast T1-weighted images of the brain on which a well-defined, hypointense cystlike lesion is identified (*). C: Transverse sonogram of the cerebellum imaged from the foramen magnum on which the cyst appears as a well-defined, oval, anechoic lesion (*). D: Longitudinal sonogram of the cyst. The bone of the skull and vertebral column prevents visualization of portions of the brain and spine, but the part of the brain (arrowheads) can be seen through the foramen magnum. A portion of the spinal cord (SC) can also be observed as it joins the medulla oblongata (M) rostrally. Cursors have been placed to measure the cyst in the cerebellum. Images courtesy of D. Penninck and S. Hecht. E and F: Sonograms of a 1-year-old Chihuahua with hydrocephalus and a quadrigeminal cyst. E: Sagittal sonogram showing the quadrigeminal cyst (Q) and confluence of the dilated lateral ventricles (LV). F: Transverse sonogram. LLV, left lateral ventricle; M, midbrain; and RLV, right lateral ventricle. Images courtesy of B. Poteet, Gulf Coast Veterinary Specialists, Houston.
Agenesis of the corpus callosum has been reported uncommonly in dogs (Spaulding and Sharp 1990). In people, sonographic findings include lateral separation of the rostral horns and bodies of the lateral ventricles, elevation and variable dilation of the third ventricle, and dilation of the occipital horns. The bundles of Probst cause concavity of the medial wall of the lateral ventricles. In dogs, enlargement and dorsal displacement of the third ventricle can be seen (Figure 1.19).
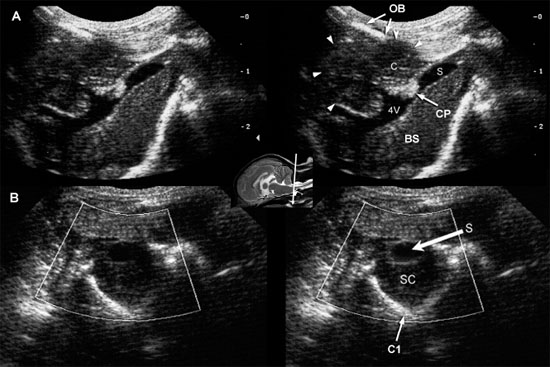
Chiari-like malformations are conditions in which there is variable pathology, such as malformation of the craniovertebral junction, cerebellar dysplasia, and elongation or displacement of portions of the cerebellum (Figure 1.20).
Herniation of the cerebellum can obstruct CSF flow, causing hydrocephalus and syringomyelia (Ettinger and Feldman 2005). Chiari type I malformations have been reported to occur in the Cavalier King Charles breed, with anomalies of the first cervical vertebra and skull, and in Maltese dogs (Kirberger et al. 1997). In some dogs, these conditions can be diagnosed by using the foramen magnum to provide an acoustic window in evaluating the cerebellum, fourth ventricle, spinal cord, and central canal.
A condition resembling Dandy-Walker syndrome of children has been reported in a Boston terrier (Nourreddine et al. 2004). The puppy exhibited ataxia, rolling, and intention tremors. Sonographic findings can include hypoplasia of the cerebellar vermis, confluence of the lateral ventricles, enlargement of the third and lateral ventricles, and cystic lesions within the cerebellum. A fluid accumulation seen between the lateral ventricles and the cerebellum was determined to be a cyst associated with the fourth ventricle.
Figure 1.19. Agenesis of the corpus callosum and hydrocephalus. Images of the brain of a young puppy with severe neurological deficits. The right and left lateral ventricles are greatly dilated. The third ventricle is enlarged and displaced dorsally. A: Rostral transverse sonogram showing marked dilation of the lateral ventricle. B: Transverse sonogram angled caudally to image the vermis of the cerebellum. The third ventricle is enlarged and displaced dorsally. C: Parasagittal sonogram with the ultrasound beam angled laterally to image the enlarged left lateral ventricle. D: Sagittal sonogram showing marked enlargement and dorsal displacement of the third ventricle. E: Radiograph of the brain after ventriculography was performed using an iodinated contrast medium. The lateral ventricles (arrows) are greatly dilated. The third ventricle (outlined in black) is greatly dilated and displaced dorsally. 3, third ventricle; IA, interthalamic adhesion; LLV, left lateral ventricle; RLV, right lateral ventricle; and V, vermis.
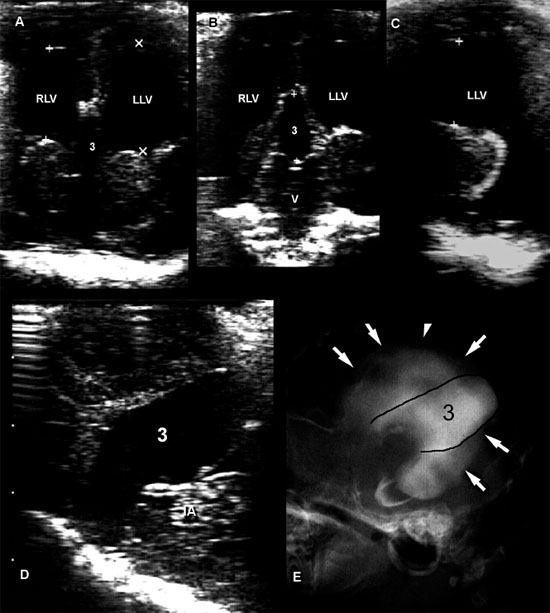
Figure 1.20. Chiari-like malformation. Sagittal (A) and transverse (B) sonographic images obtained through a large foramen magnum in a dog with occipital dysplasia. The cerebellum (C, arrowheads) protrudes into the foramen, below the occipital bone (OB). A tubular anechoic fluid collection is observed along the middorsal portion of the cranial cervical spinal cord (SC), consistent with syringomyelia (S). The fourth ventricle (4V) is also dilated. Malformation of the skull enables better visualization of the brain than usual (compare with Figure 1.18). BS, brain stem; and CP, choroid plexus of the fourth ventricle. Images courtesy of M. A. d’Anjou.
Cerebrocortical hypoplasia has been reported to be caused by loss or abnormal proliferation and/or migration of cortical neurons because of specific inherited abnormalities, toxins, in utero infections, or vascular insults. In some cases, lack of development shown as decreased detail of the brain echotexture might be apparent with ultrasonography either through a persistent fontanel or by viewing the brain through the foramen magnum (Figure 1.21).
Cerebellar hypoplasia, which is reduced size of the cerebellum because of abnormal development, can be caused by viral infections such as panleukopenia (feline parvovirus) in cats, toxins or other environmental influences, or genetic abnormalities, or the cause may be unknown.
Figure 1.21. Sonograms of a normal kitten and a kitten with abnormal brain development. A: Sonogram of a normal 1-week-old kitten next to the gross transverse section from a normal 1-month-old kitten. B: Sonogram of an 8-week-old kitten with severe neurological deficits caused by cerebrocortical dysplasia and abnormal myelinization. The sonogram shows a lack of detail compared with the normal kitten. The cause of this lack of detail is unknown. A gross transverse section from the kitten is seen on the left. Note the decreased visualization of white matter tracks and decreased depth of sulci.
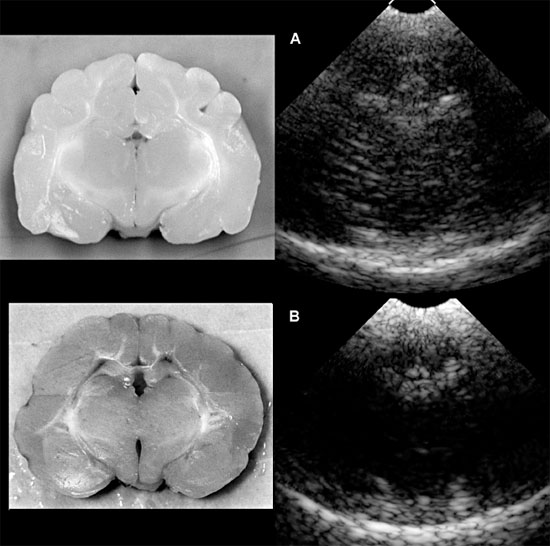
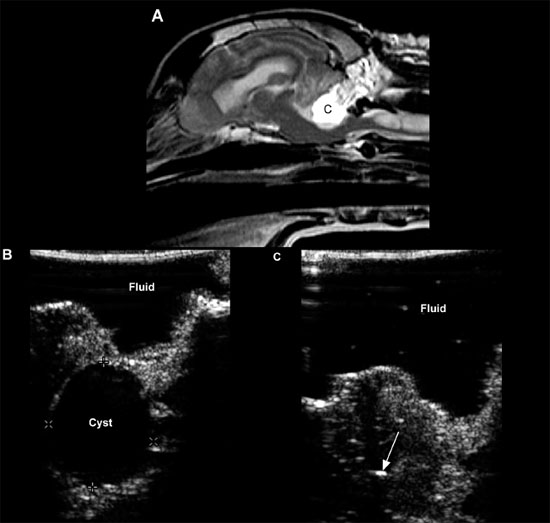
Figure 1.22. Cystic cerebellar lesion in a dog. A: Sagittal T2-weighted spin echo magnetic resonance image showing a well-defined, hyperintense cystic lesion in the cerebellum. B: Intraoperative sonogram shows an anechoic circular lesion (cyst) with some hypoechoic material around the margins. Fluid has been placed at the surgical site to enable imaging. C: Intraoperative sonogram showing the brain after drainage of the cyst. The arrow indicates the area of the lesion after suction. Images courtesy of D. Penninck and S. Hecht.
