
DEDICATION
To my wife, Elaine, for holding down the fort and looking after the kids while I embarked on this long journey. To Ray K., for helping me get started and for all the advice. To my wife, family, friends, and editors for their comments, suggestions, and proofreading.
A big thank you! Oh! There’s another book!!
ABOUT THE AUTHOR
David G. Peterson has extensive international experience managing projects and operations for large financial institutions. He has worked in North America, Europe, Middle East and Asia skillfully managing business and technical requirements, core systems enhancement and support, merger and acquisition integrations, business process reengineering, off-shoring and outsourcing.
Visit his website www.handlingtheremedy.com to find articles, his blog, videos, testimonials, and more.
www.handlingtheremedy.com
APPENDIX: CASE STUDY EXAMPLE
Company XYZ’s IT department consisted of three hundred FTEs (Full Time Equivalents) who worked together to ensure the company’s technology services were always online. One afternoon inside the company’s operations center, a display showing the status of online services and resources, such as networks, servers, mainframes, and firewalls flashed green, yellow, and then red.
A crowd of people streamed into the operations center. The CIO asked the head of operations what was happening. The question trickled down until everyone in the room was asking the same thing. Surprise turned to irritation as the failing services did not come back online and there were no answers.
Incident managers got involved, and experts from each division huddled into a room. The operations staff confirmed that some servers had restarted, communication links had gone down, firewall logs showed unusual entries, and primary servers had failed over to secondary servers. Users started to call the service desk, complaining that they couldn’t log in to the necessary services.
At this time, the CIO and head of operations asked for an update that was not “geek speak.” They were shocked to hear “we don’t know.”
The CIO asked for a status update of what and who was affected. Server administrators quickly listed several servers that were offline. The head of operations asked which services and lines of business were affected by those servers. The administrators listed a few services, but didn’t know the lines of businesses, as there was no record of who used those servers.
Members from the Incident, Problem, and Change teams started reviewing their logs to find a reason for the outage.
Does this scenario sound familiar? To prevent such occurrences management decided to adopt the alignment process of Handling the Remedy. Fifteen individuals were selected to participate:
• Five members from the Incident Team, including three incident managers and two employees who monitored various systems and services.
• Five members from the Problem Team—three problem managers and two other employees who had participated in resolving a recent problem.
• Five members from the Change Team—three change managers and two Change Advisory Board (CAB) members who were responsible for approving changes.
All fifteen members were asked to complete Q&A Parts 1, 2 and 3. (The values for each member in this example were selected randomly, and the results averaged.)These are the Incident Team’s results:
These are the Incident Team’s results:
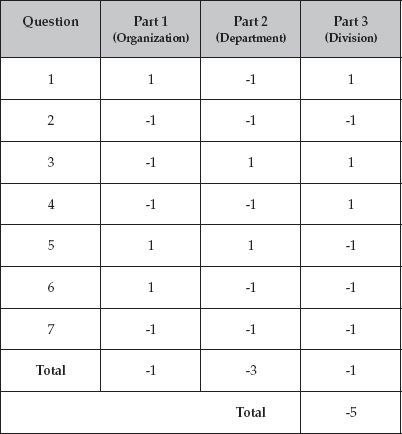
These are the Problem Team’s results:

These are the Change Team’s results:
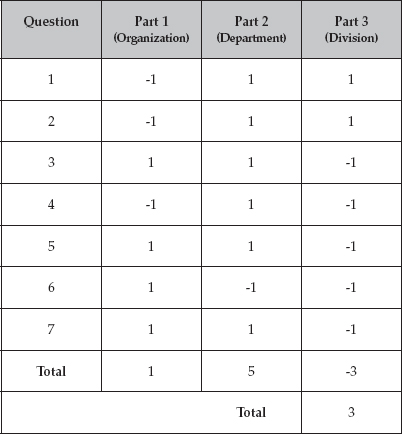
Diagram 1
The readings shown in Diagram 1 come from the Change team’s Q&A exercise—so much for going in a straight line!
This diagram represents the alignment to the organization, the department and division. You can see that the Change team is going in a different direction from its parent department and the organization.
Using this diagram and the question-and-answer scoring, you can identify the areas that need to be aligned to help the change team proceed in the same direction as the rest of the organization. Teams can repeat this exercise later to check progress.
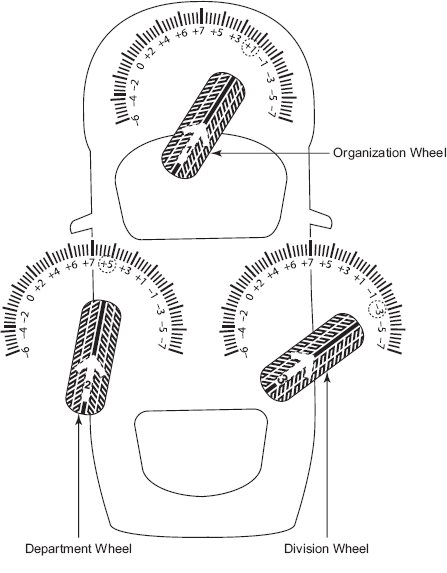
Diagram 1
Picture three cars—one each for the Incident, Problem, and Change teams—and put them side by side. Based on the earlier scores, if the cars took to the road, they would crash into each other!
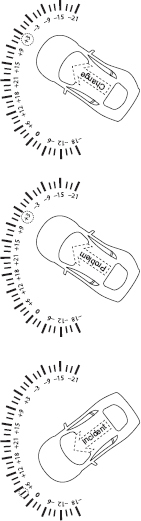
Diagram 2
By plugging in the scores, you can see how each team stacks up and how they stack up against each other. In the example below, the Change team and Problem team have a combined score of +6, but when either of those teams work with the Incident team, their combined score drops to -2. The possible scores between the two teams range from -42 to +42.
The department score is positive (+1), with a possible range of -63 to +63. From the scores, it is clear that the positive influence of the problem and change teams is masking the issues faced by the incident team. You can clearly see that the incident team should be the first focus of the organization.
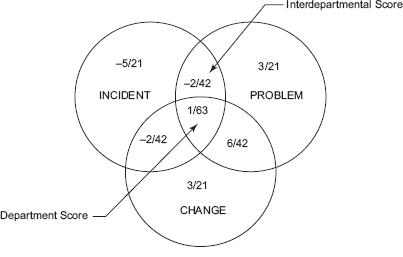
Diagram 2
INTRODUCTION